Calculator & Desmos Mastery
By the end of this lesson, you’ll be able to:
- Use a built-in graphing calculator efficiently on computer-based math questions.
- Use Desmos to solve common algebra, function, statistics, and geometry problems.
- Recognize when Desmos is faster than traditional methods.
- Avoid common calculator mistakes.
- Decide when to use technology and when to solve by hand.
Why This Lesson Matters
Many computer-based math assessments give students access to powerful calculator technology.
Many students think of the calculator as a tool for arithmetic only.
Top scorers use it as a problem-solving tool.
The goal of this lesson is not to replace mathematics. The goal is to learn how to use technology strategically to save time, reduce mistakes, and improve accuracy.
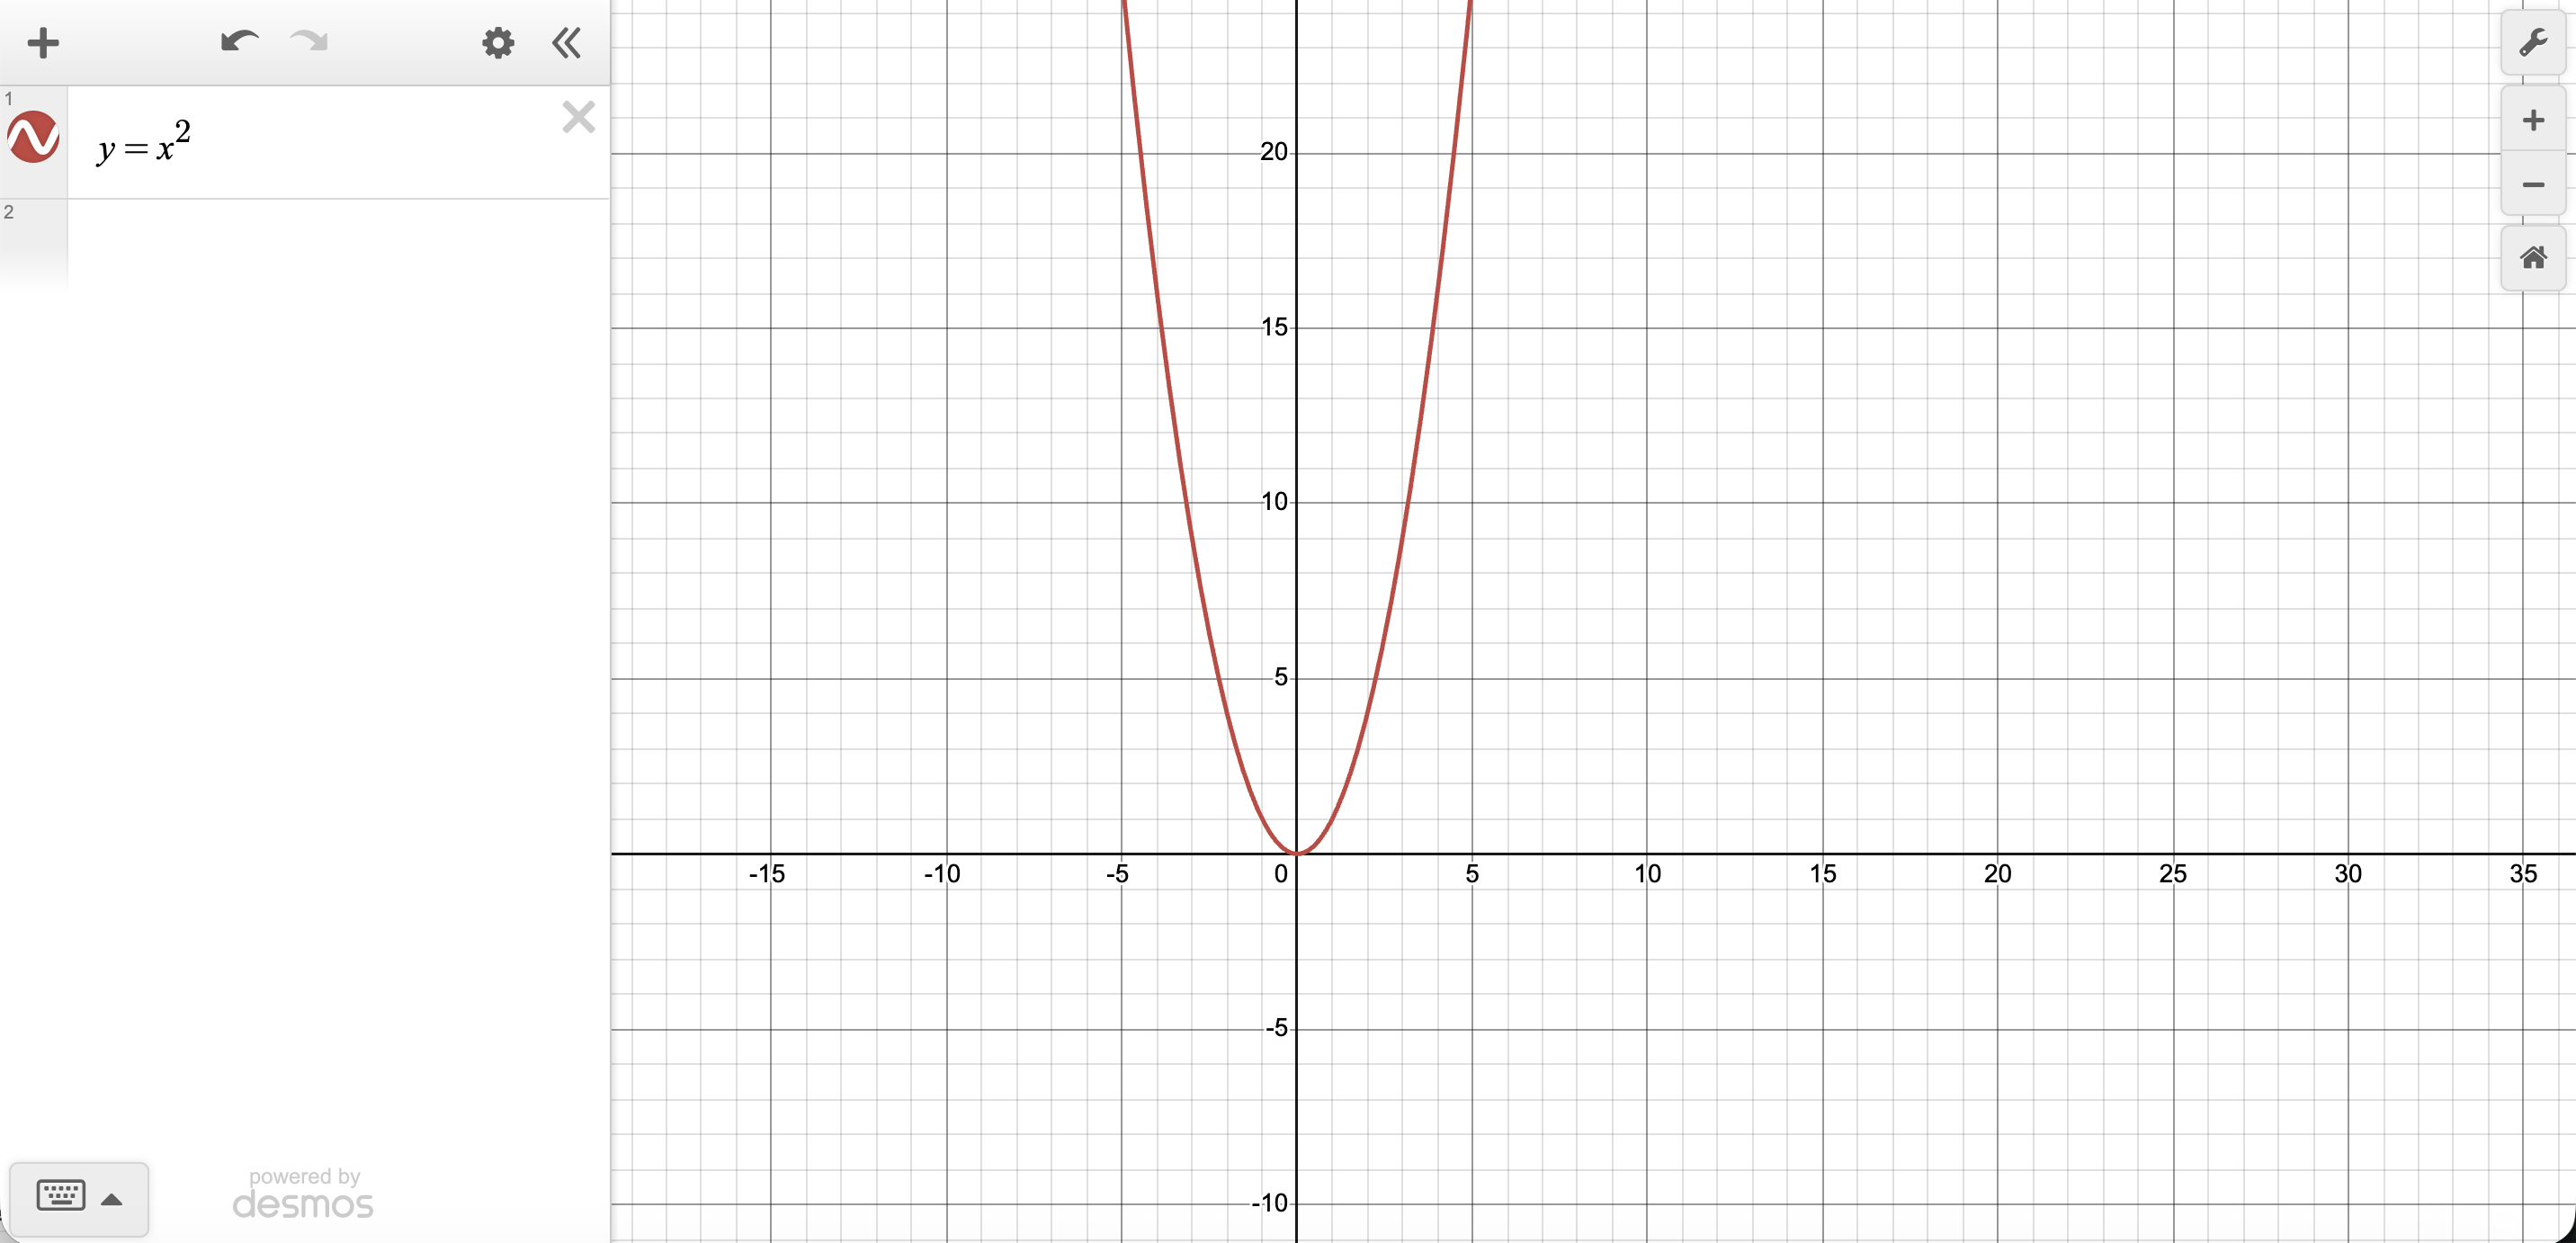
Calculator Use on Computer-Based Tests
| Feature | Typical Availability | Best Use |
|---|---|---|
| Built-in graphing calculator | Often available | Algebra, functions, systems, and graphs |
| Desmos-style graphing | Often available | Visualizing equations, intersections, and data |
| Personal calculator | Depends on the assessment | Arithmetic, roots, powers, and quick checks |
| Graphing technology | Useful when allowed | Geometry, trigonometry, functions, and statistics |
The exact testing platform may change over time, but the Desmos skills in this lesson are broadly useful whenever graphing technology is available.
When Should You Use Desmos?
The best students do not use Desmos for every problem.
Instead, they ask:
Will Desmos solve this faster than I can?
Use Desmos when it helps you:
- Visualize a graph
- Find an intersection
- Find roots or zeros
- Evaluate functions
- Compare models
- Test answer choices
- Check your work
Avoid Desmos when:
- The arithmetic is simple
- A formula gives the answer immediately
- The setup would take longer than solving
- The question is mostly conceptual
- Exact algebraic form is required
The Five Most Important Desmos Skills
- Graphing equations
- Finding intersections
- Finding roots and zeros
- Using tables
- Evaluating functions
Mastering these five skills alone can save several minutes on a test.
Worked Examples
Skill 1: Graphing Equations
Suppose you need to graph:
\[ y = 2x + 3 \]
In Desmos, type:
y=2x+3Desmos immediately displays the graph.
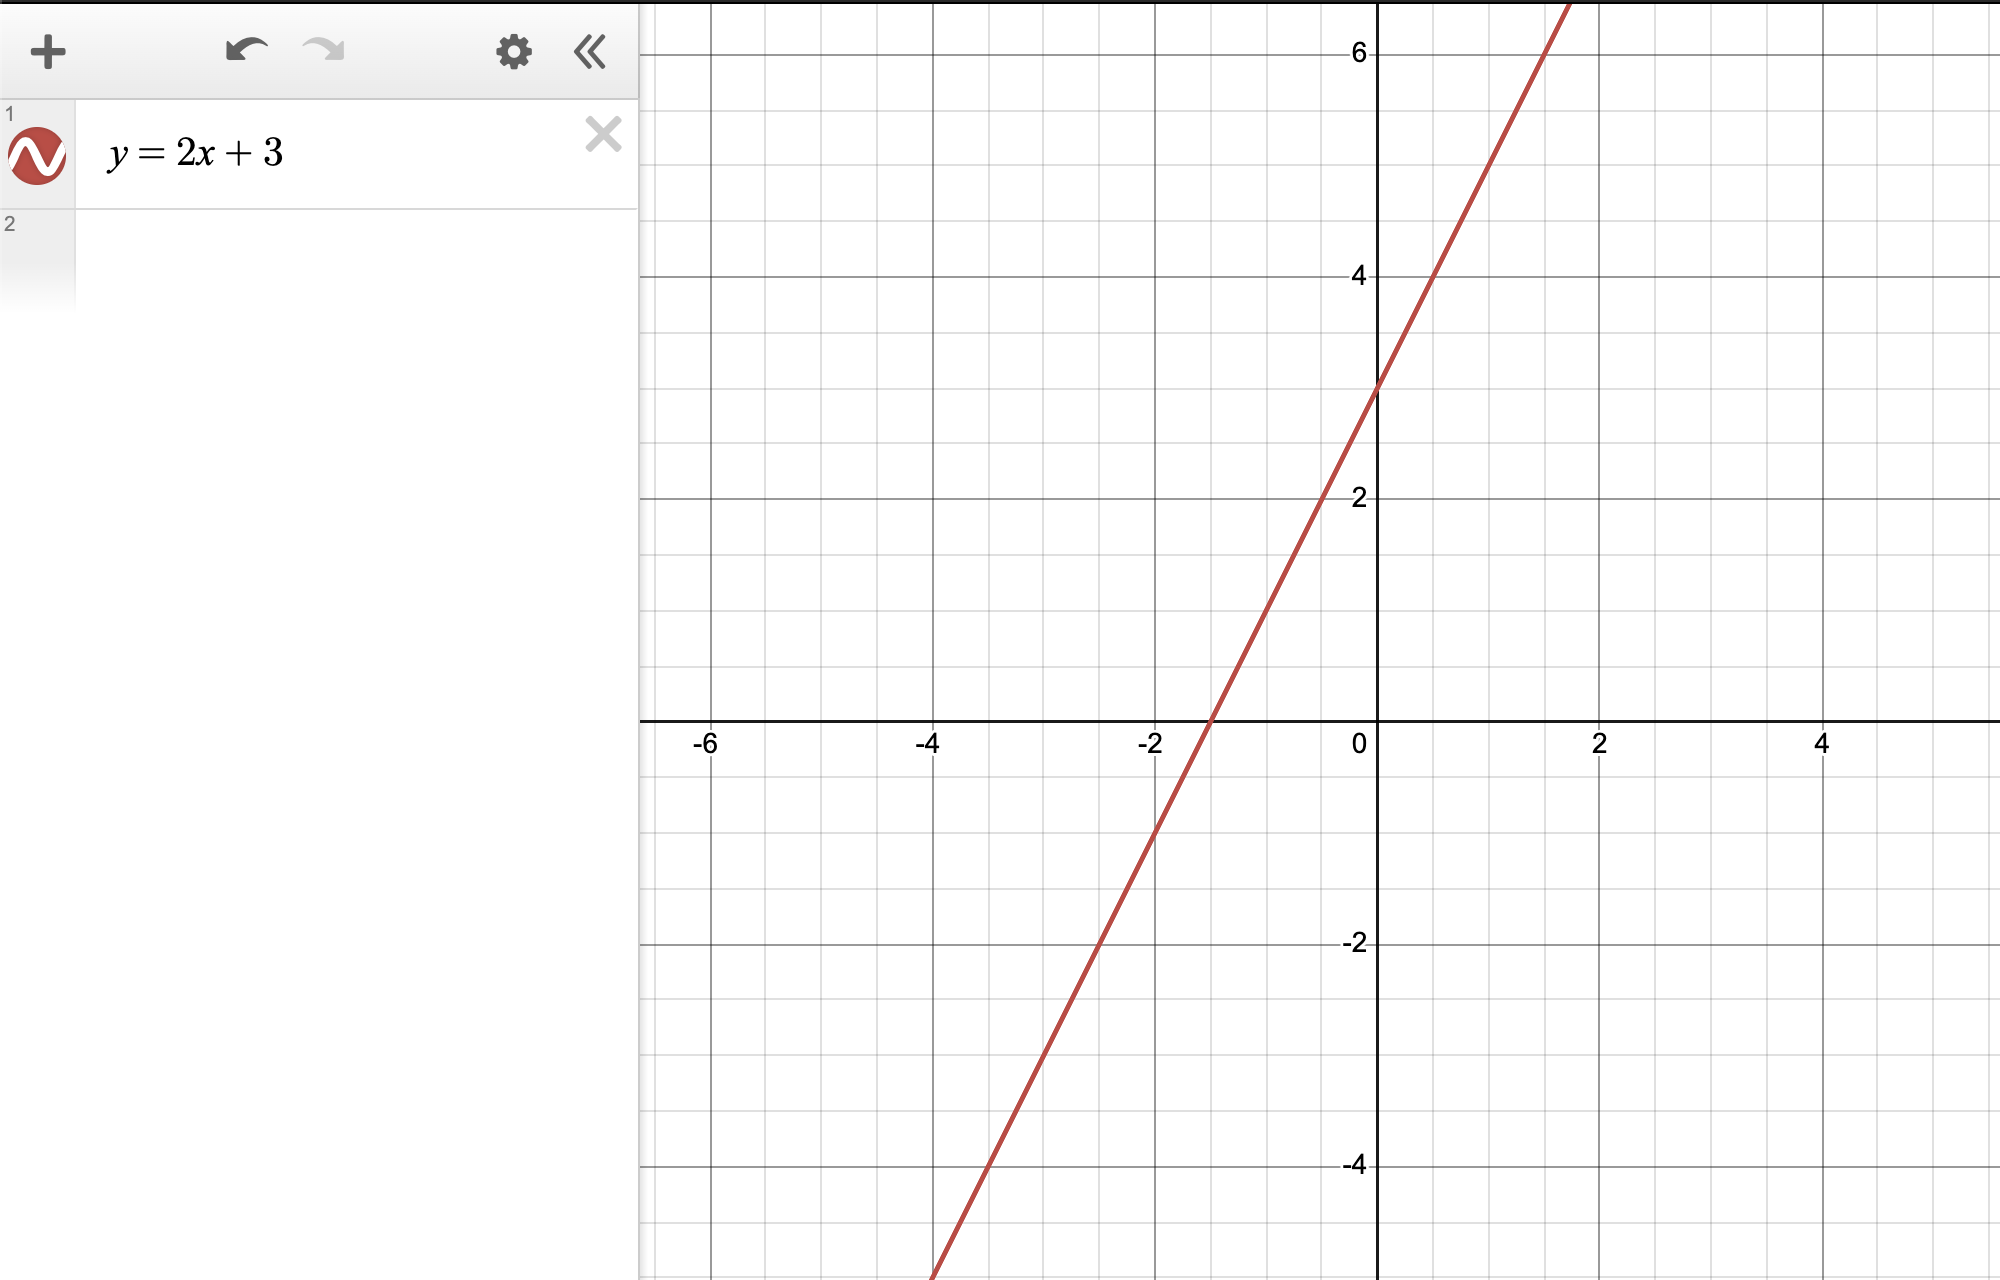
Graphing is especially helpful when the question asks about slope, intercepts, intersections, or the shape of a function.
Skill 2: Solving Equations with Intersections
Suppose you need to solve:
\[ 2x + 5 = 17 \]
Instead of solving the equation by hand, graph each side separately:
\[ y = 2x + 5 \]
and
\[ y = 17 \]
The solution is the x-coordinate of the intersection.
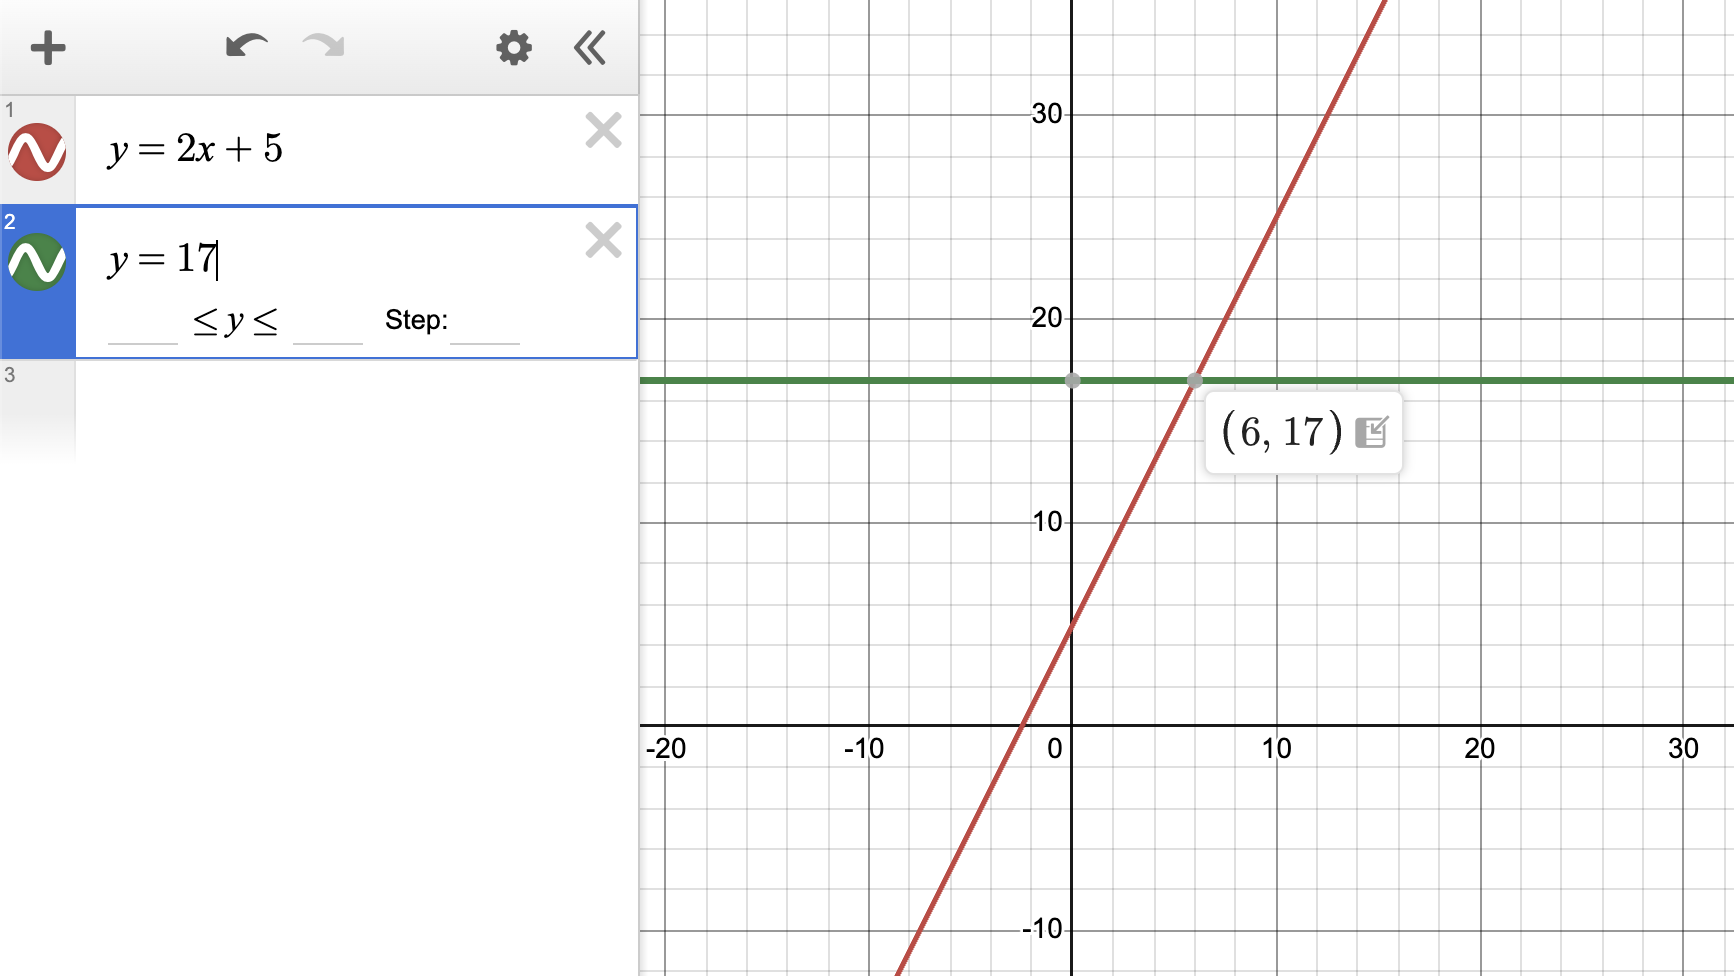
Desmos Steps:
- Enter the left side as one equation.
- Enter the right side as another equation.
- Click or tap the intersection point.
- Read the x-coordinate.
Any equation of the form
\[ f(x) = g(x) \]
can be solved graphically by plotting both sides.
Skill 3: Solving Systems of Equations
Consider the system:
\[ y = 3x - 2 \]
\[ y = -x + 6 \]
Enter both equations into Desmos.
The solution is the intersection point.
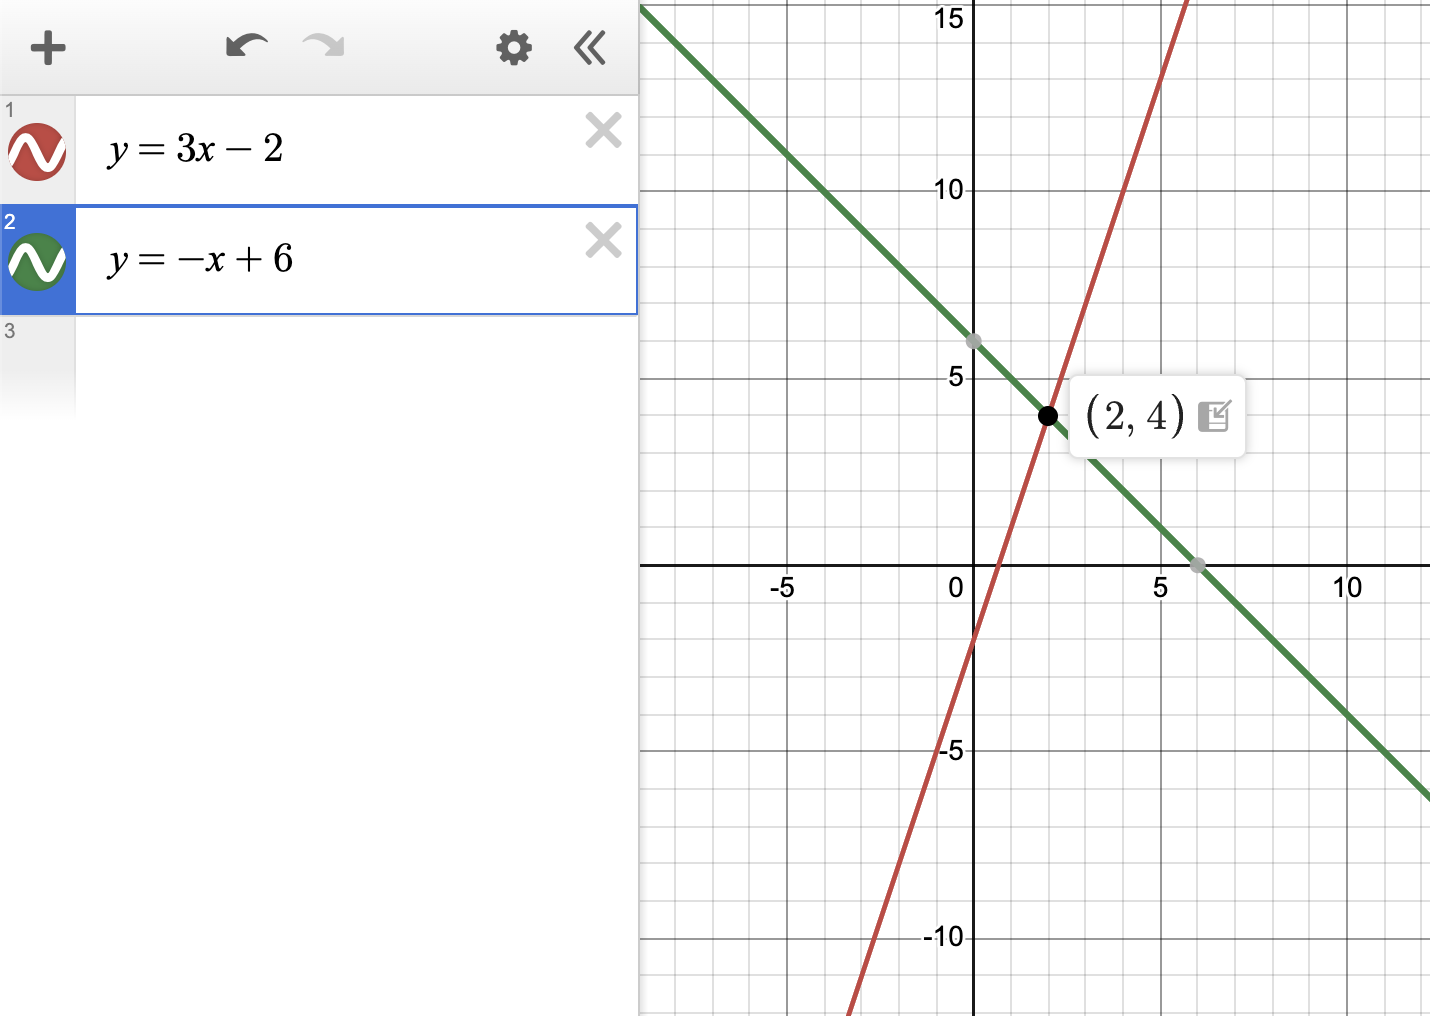
The solution is:
\[ (2,4) \]
For many systems questions, graphing is faster than substitution or elimination.
Skill 4: Finding Roots and Zeros
Consider:
\[ y = x^2 - 5x + 6 \]
The roots occur where the graph crosses the x-axis.
These are also called:
- zeros
- solutions
- x-intercepts
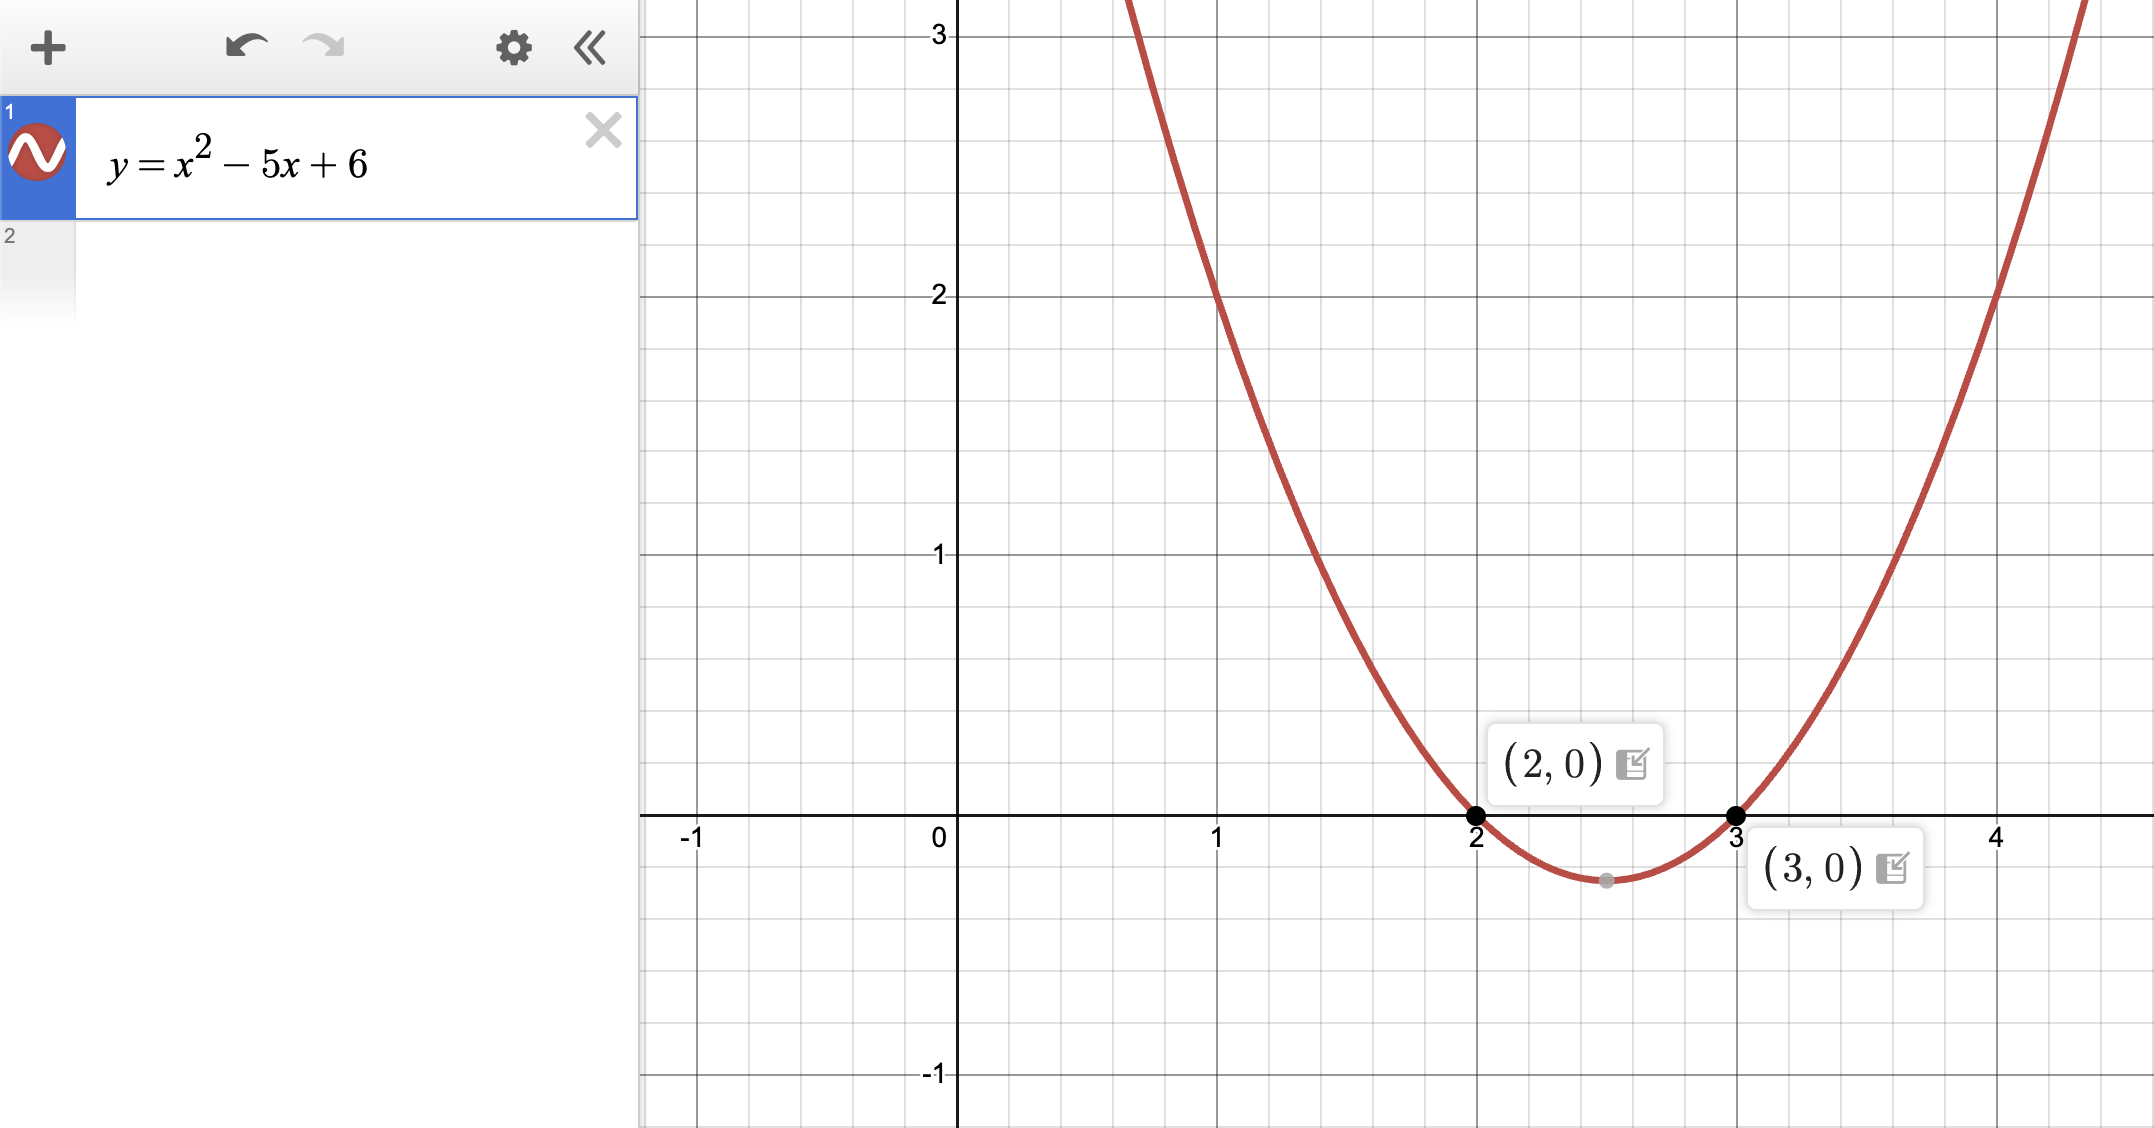
The roots are:
\[ x = 2 \]
and
\[ x = 3 \]
Different questions may use different vocabulary, but these words often refer to the same idea.
| Word | Meaning |
|---|---|
| Root | x-value that makes the function equal 0 |
| Zero | x-value where \(f(x)=0\) |
| Solution | x-value that satisfies the equation |
| x-intercept | Point where the graph crosses the x-axis |
Skill 5: Using Tables
Desmos tables are one of the most underused features.
Define:
\[ f(x) = 2x^2 - 3x + 1 \]
Then create a table and enter values of \(x\).
For example, when:
\[ x = 4 \]
Desmos gives:
\[ f(4) = 21 \]
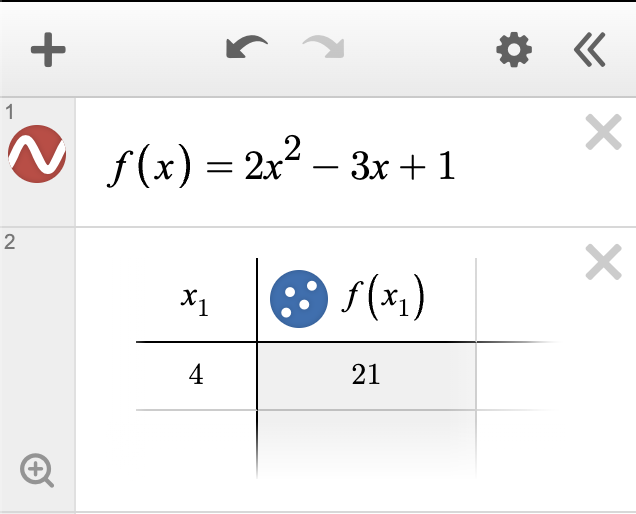
Tables are especially useful when multiple function values must be evaluated quickly.
Desmos tables can also be used to create scatterplots and regression models. This feature is demonstrated in the Line of Best Fit lesson.
Evaluating Functions Directly
You can also define:
f(x)=2x^2-3x+1Then type:
f(4)Desmos returns:
21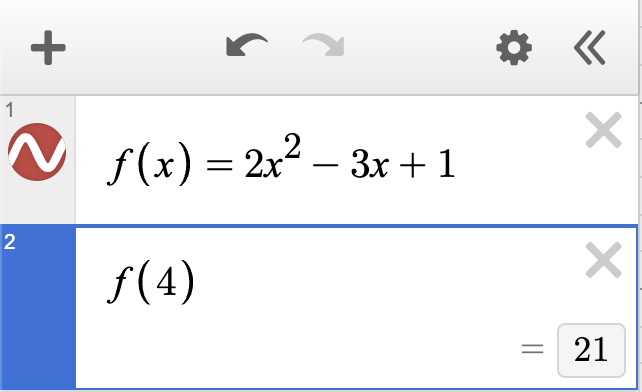
Testing Answer Choices
Sometimes testing answer choices is faster than solving.
Example:
\[ 3x + 7 = 28 \]
Choices:
- 5
- 6
- 7
- 8
Substitute choices until one works.
For \(x = 7\):
\[ 3(7) + 7 = 28 \]
So the answer is C.
Testing choices works best when:
- Choices are numerical
- The algebra looks messy
- You only need one valid solution
Word Problems with Intersections
Many word problems compare two quantities.
Example:
A gym charges a $25 signup fee plus $12 per month. Another gym charges no signup fee but $17 per month.
Let \(x\) be the number of months and \(y\) be the total cost.
Gym A:
\[ y = 25 + 12x \]
Gym B:
\[ y = 17x \]
Graph both models.
The intersection represents the point where the costs are equal.
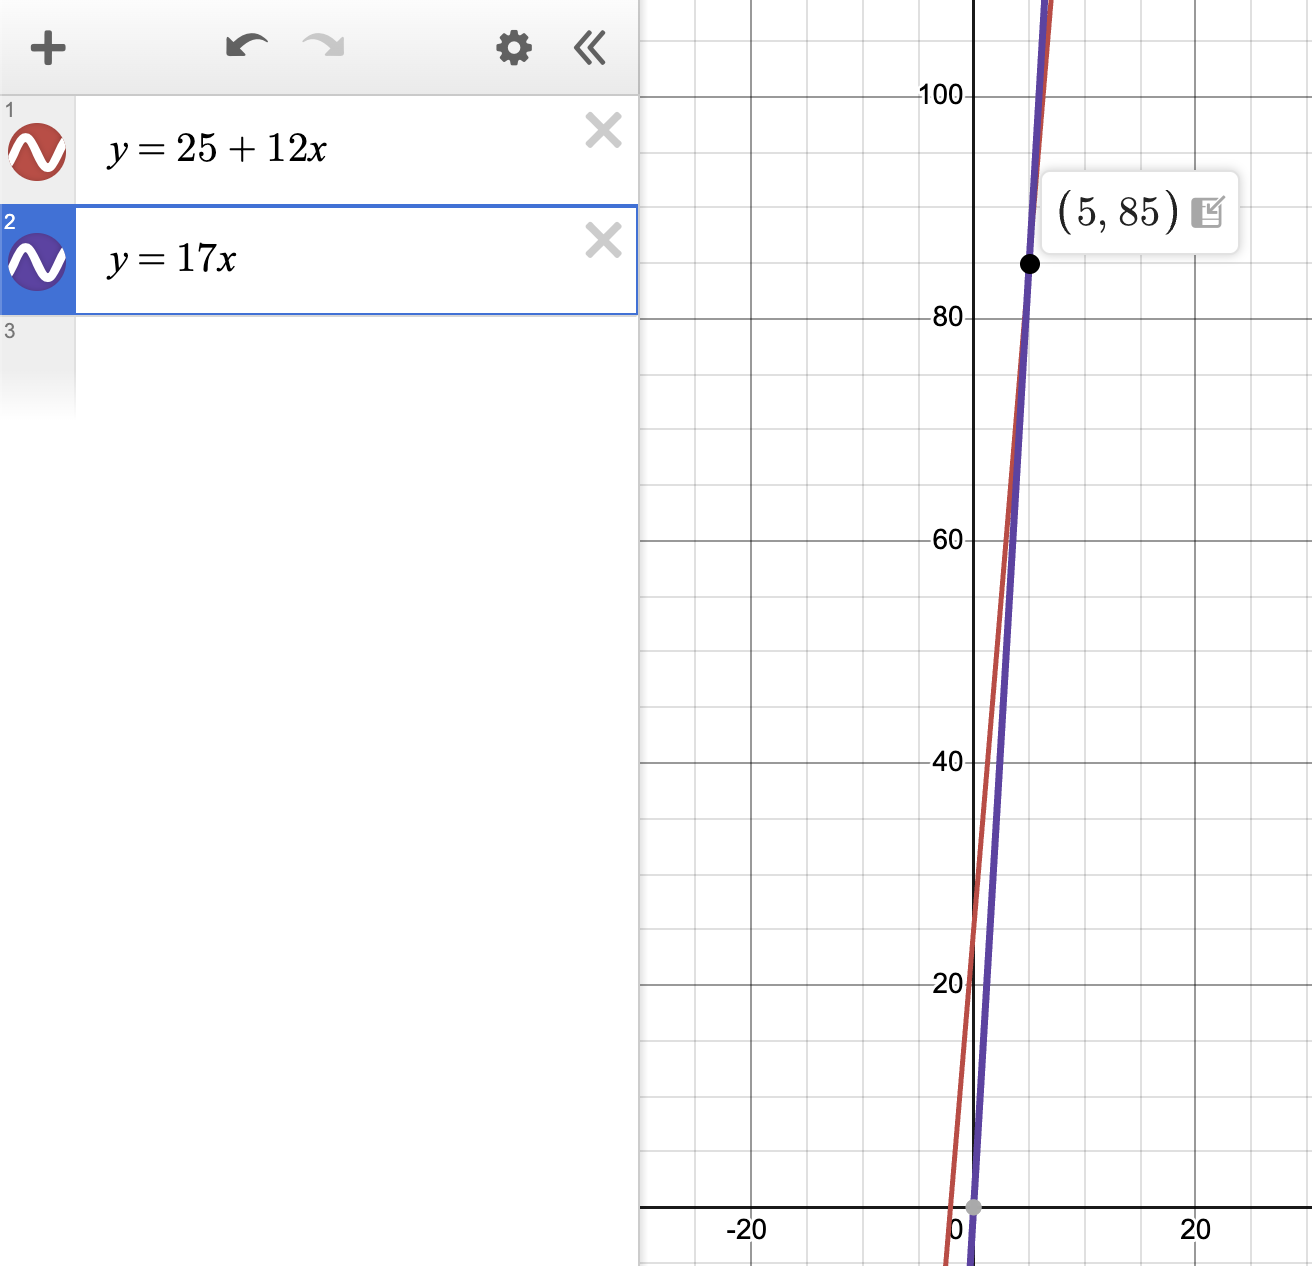
The plans cost the same after:
\[ 5 \]
months.
Finding Maximums and Minimums
For a quadratic such as:
\[ y = -16x^2 + 64x + 5 \]
the vertex represents the maximum value.
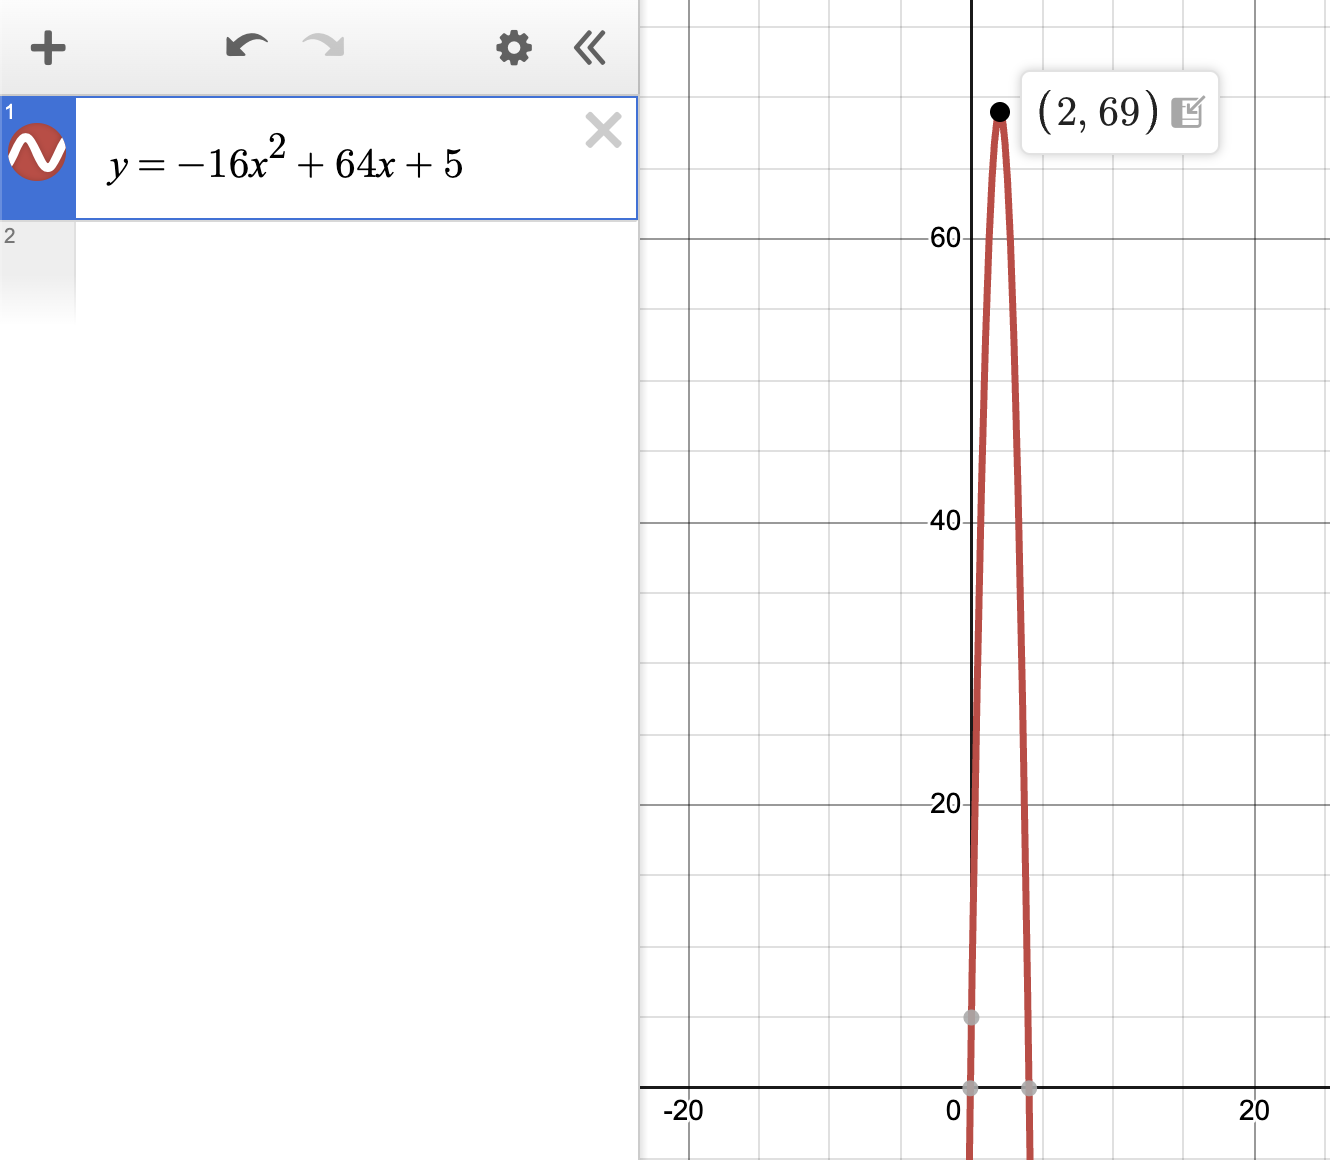
This is useful for:
- height problems
- revenue problems
- profit problems
- area optimization problems
Whenever a quadratic models height, profit, revenue, or area, the test may ask about the vertex.
Using Sliders
Desmos can create sliders automatically.
Enter:
y=ax+3Desmos can create a slider for \(a\).
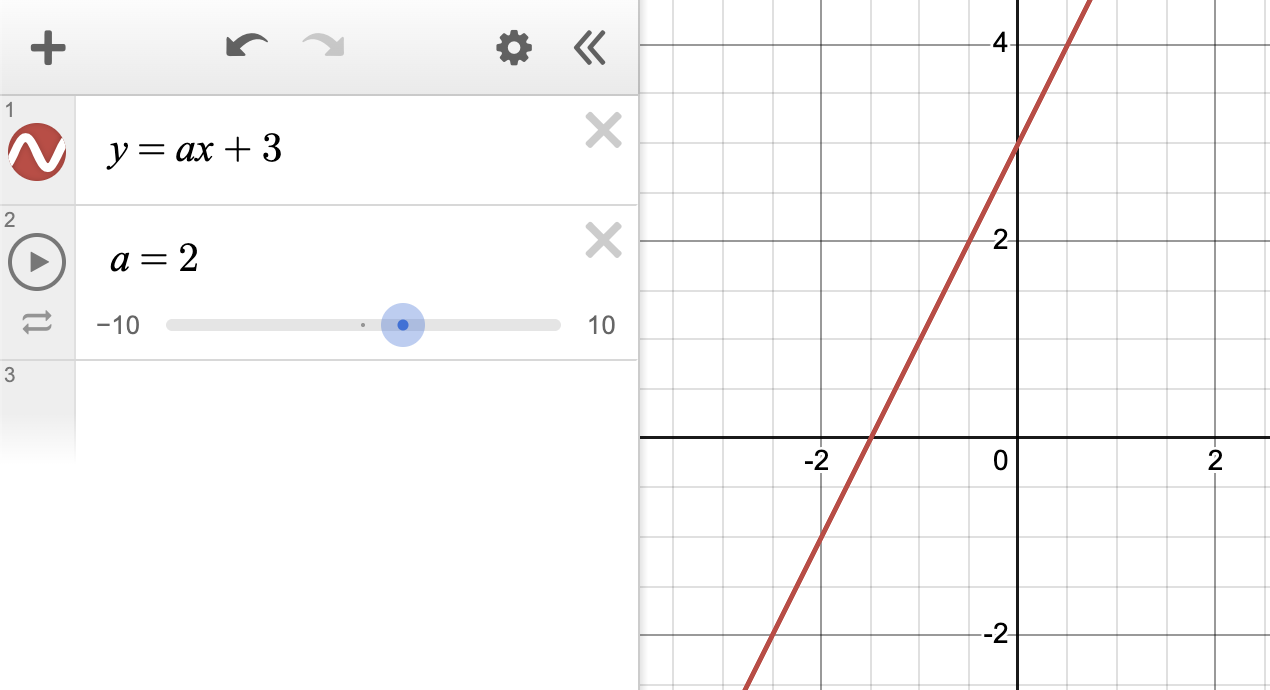
Sliders are useful for:
- exploring patterns
- understanding parameters
- visualizing transformations
Sliders are helpful for exploration, but final answers should usually be exact rather than approximate.
Function Transformations
Compare:
\[ y = x^2 \]
and
\[ y = (x - 3)^2 + 2 \]
Graph both functions.
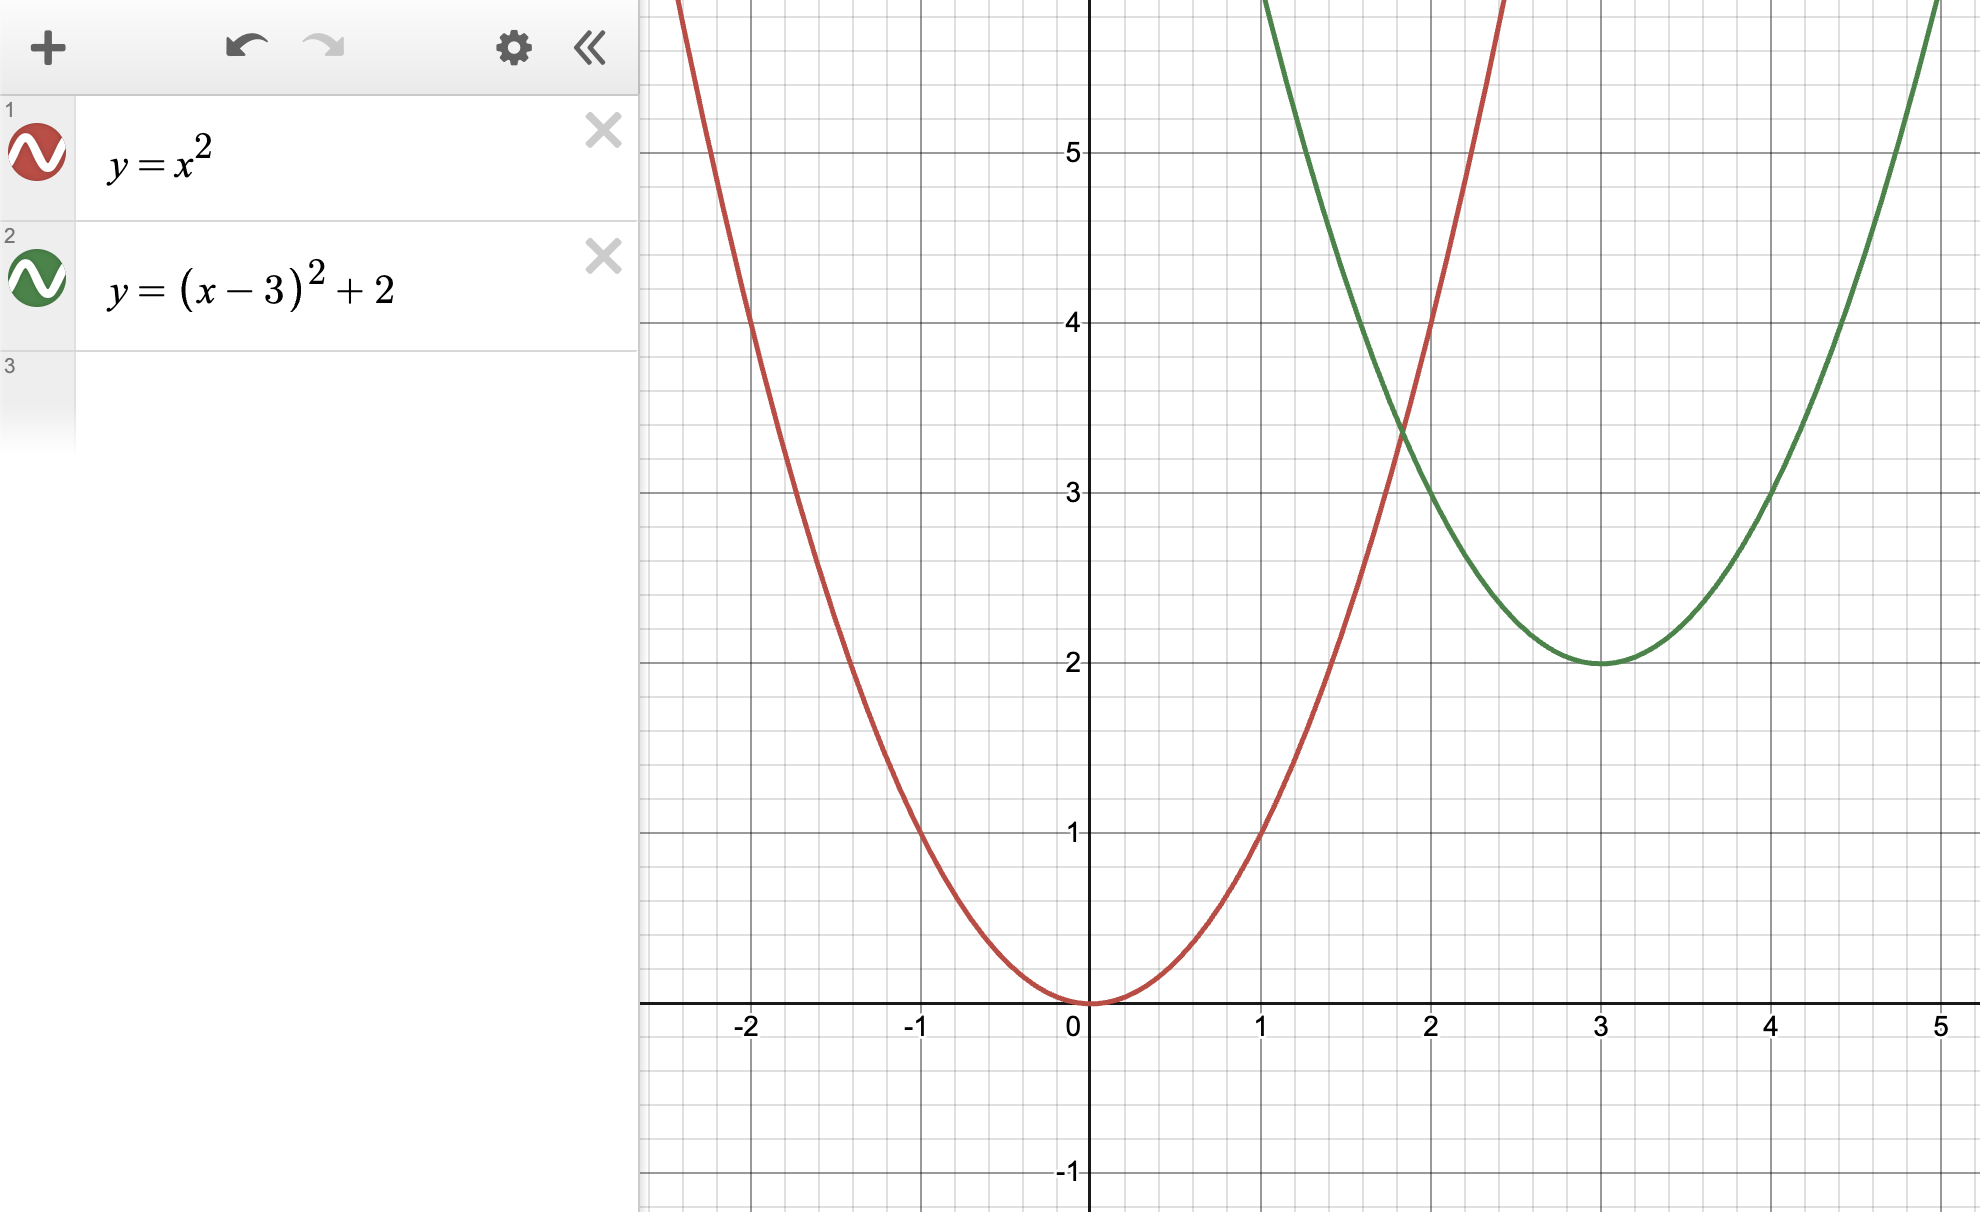
The transformed graph is shifted:
- right 3 units
- up 2 units
Graphing Inequalities
Desmos can graph inequalities such as:
\[ y > 2x - 1 \]
and
\[ y \le -x + 4 \]
The overlap of the shaded regions represents the solution set.
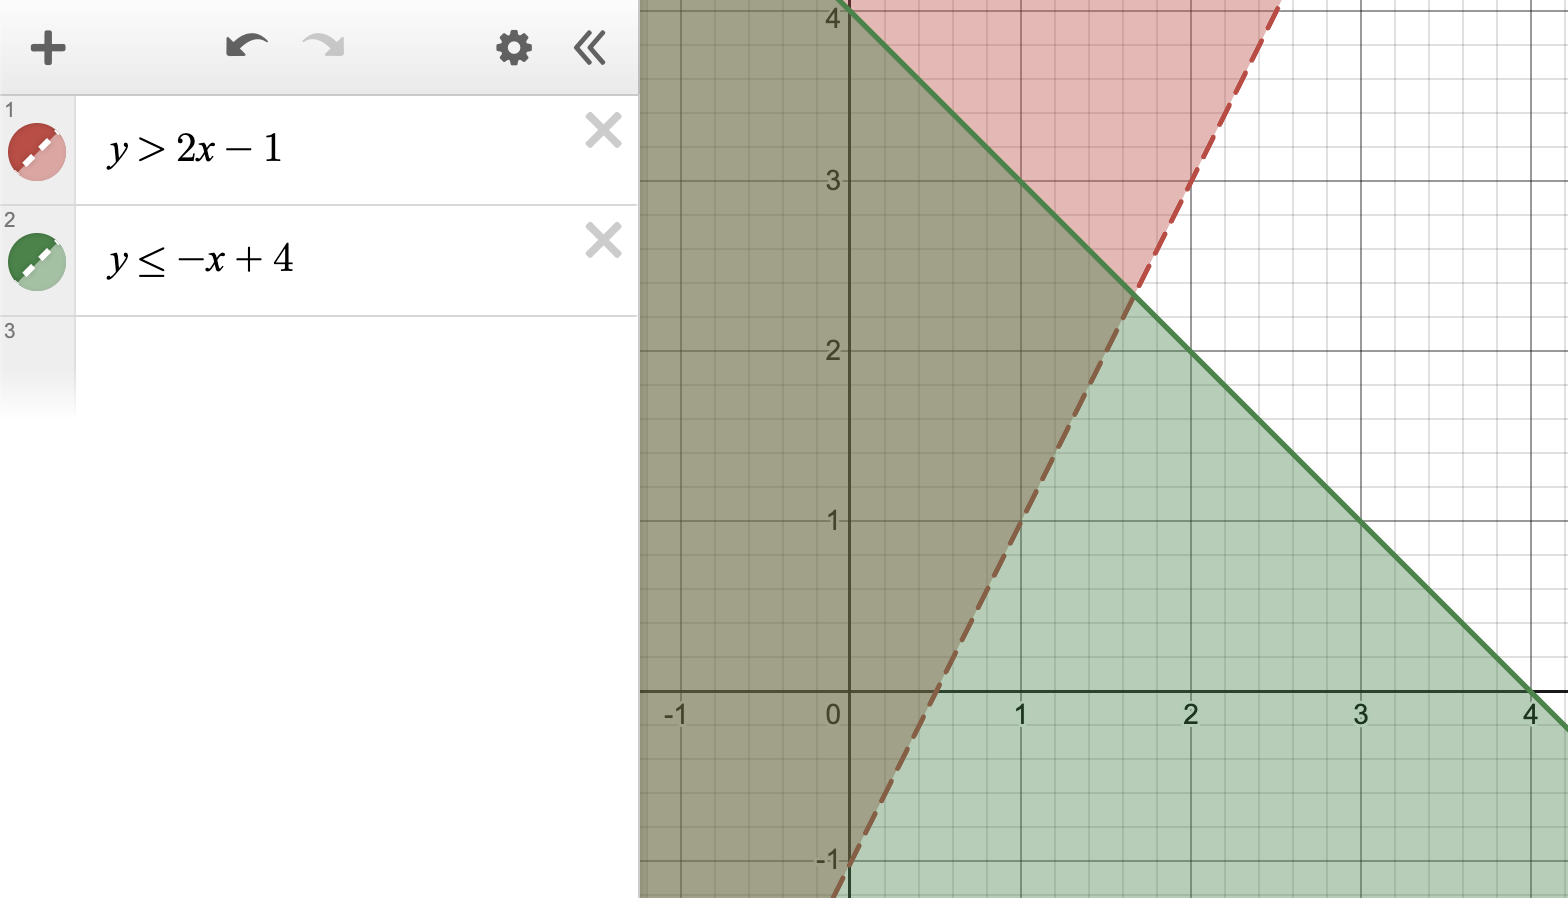
Remember:
- Solid line means included: \(\le\) or \(\ge\)
- Dashed line means not included: \(<\) or \(>\)
- Overlap means all inequalities are true
Additional Applications
Some advanced topics also benefit from graphing technology.
Examples include:
Trigonometric Functions

Graphing trigonometric functions can help visualize amplitude, period, maximums, minimums, and intercepts. Desmos makes it easier to understand how changes to an equation affect the graph.
Piecewise Functions
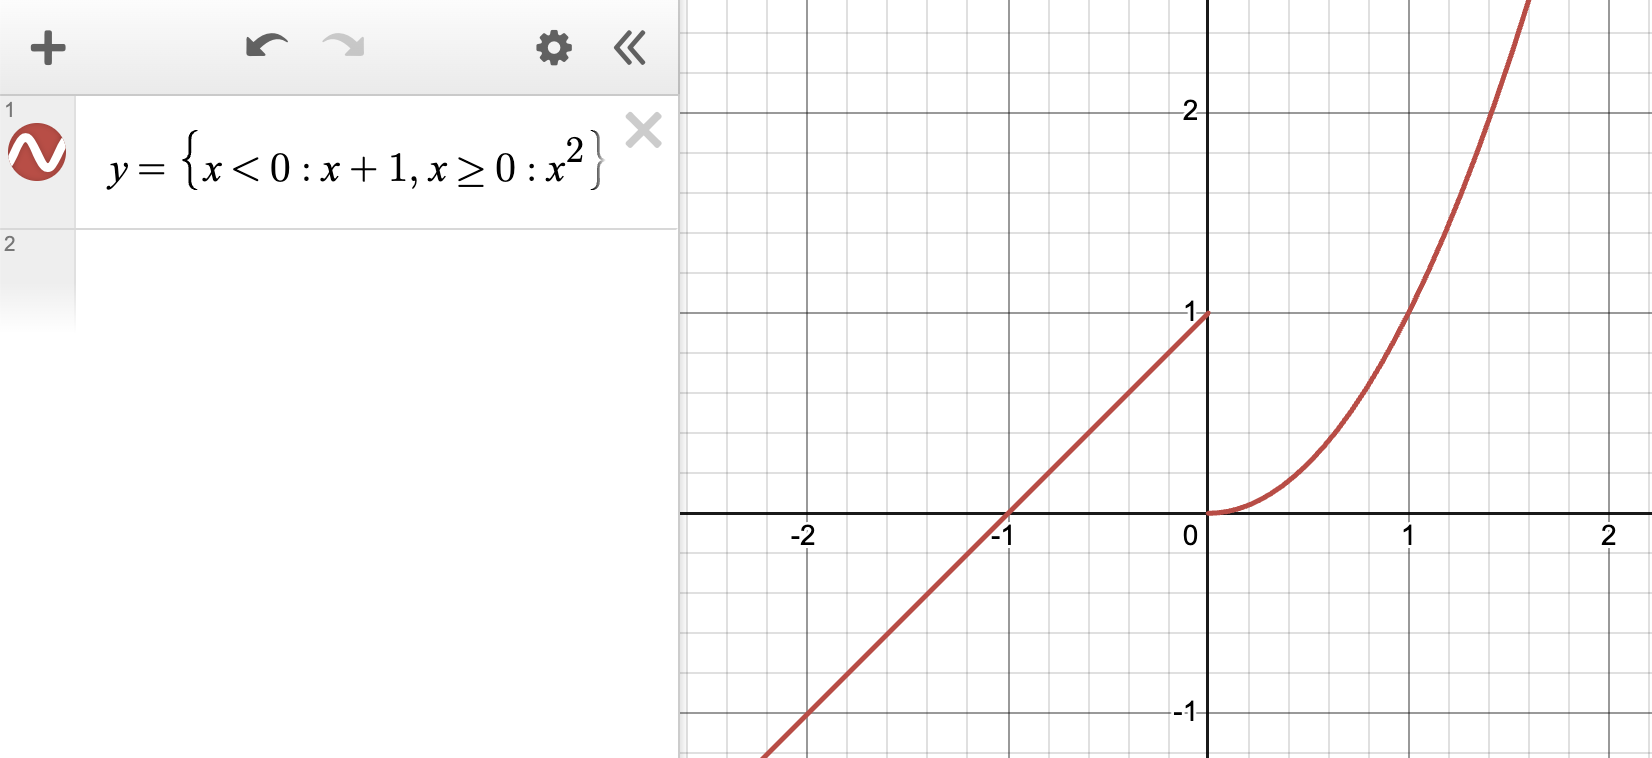
Piecewise functions use different rules on different intervals of the domain. Desmos can display each piece simultaneously, making it easier to identify endpoints, discontinuities, and function behavior.
Desmos piecewise syntax follows the pattern:
y = {
condition : expression,
condition : expression,
...
}
Each condition specifies the interval where that rule applies.
Conic Sections
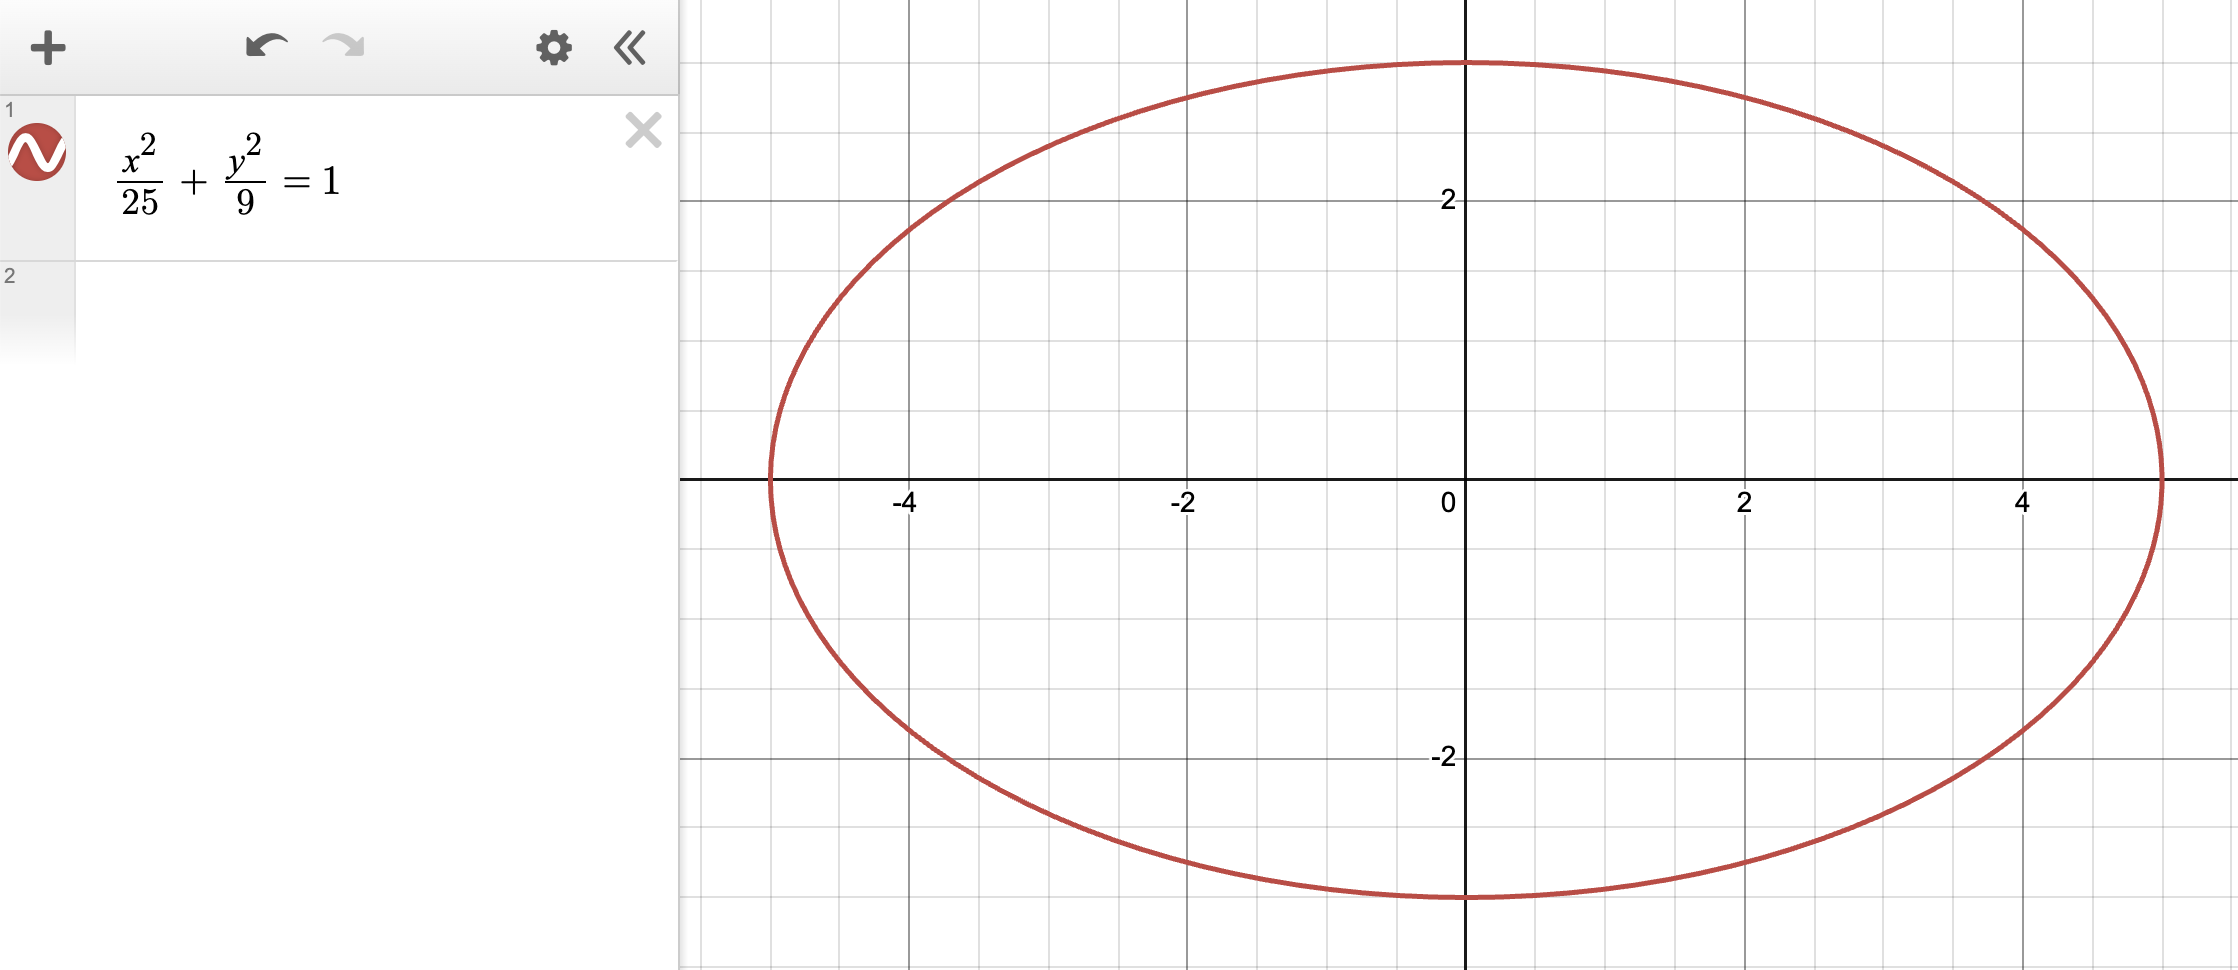
Conic section questions may include circles, ellipses, parabolas, and hyperbolas. Graphing these equations in Desmos can help students visualize their shapes and key features. Desmos can also help verify intercepts, vertices, centers, and symmetry.
Additional Useful Desmos Features
The examples in this lesson focus on common graphing-calculator applications. Desmos also includes several built-in functions that can save time on specific problems.
Absolute Value
Use:
abs(x)Example:
y = abs(x - 3)This is useful for graphing and checking absolute value equations and inequalities.
Greatest Common Divisor and Least Common Multiple
Use:
gcd(24,36)and
lcm(12,18)Desmos returns:
12and
36These functions can help verify arithmetic and number theory calculations.
Permutations and Combinations
Desmos includes built-in functions for permutations and combinations.
Use:
nCr(10,3)to compute combinations, and use:
nPr(10,3)to compute permutations.
Desmos returns:
nCr(10,3) = 120
nPr(10,3) = 720
These functions can help verify counting and probability calculations.
Complex Numbers
Desmos supports the imaginary unit:
iExample:
(3 + 2i)(1 - i)This can help check complex number operations.
Function Composition
Functions can be defined and combined directly.
Example:
f(x) = 2x + 1
g(x) = x^2

f(g(x))
Desmos automatically computes the composition.
This can be useful when working with composite functions.
Calculator vs. Desmos
| Task | Best Tool |
|---|---|
| Arithmetic | Calculator |
| Percent calculations | Calculator |
| Square roots | Calculator |
| Function evaluation | Calculator or Desmos |
| Systems of equations | Desmos |
| Graph interpretation | Desmos |
| Roots and zeros | Desmos |
| Transformations | Desmos |
| Inequalities | Desmos |
Common Calculator Mistakes
Avoid these common errors:
- Forgetting parentheses
- Reading the wrong coordinate
- Using rounded values when exact values are required
- Misinterpreting graph scales
- Assuming a graph window shows every solution
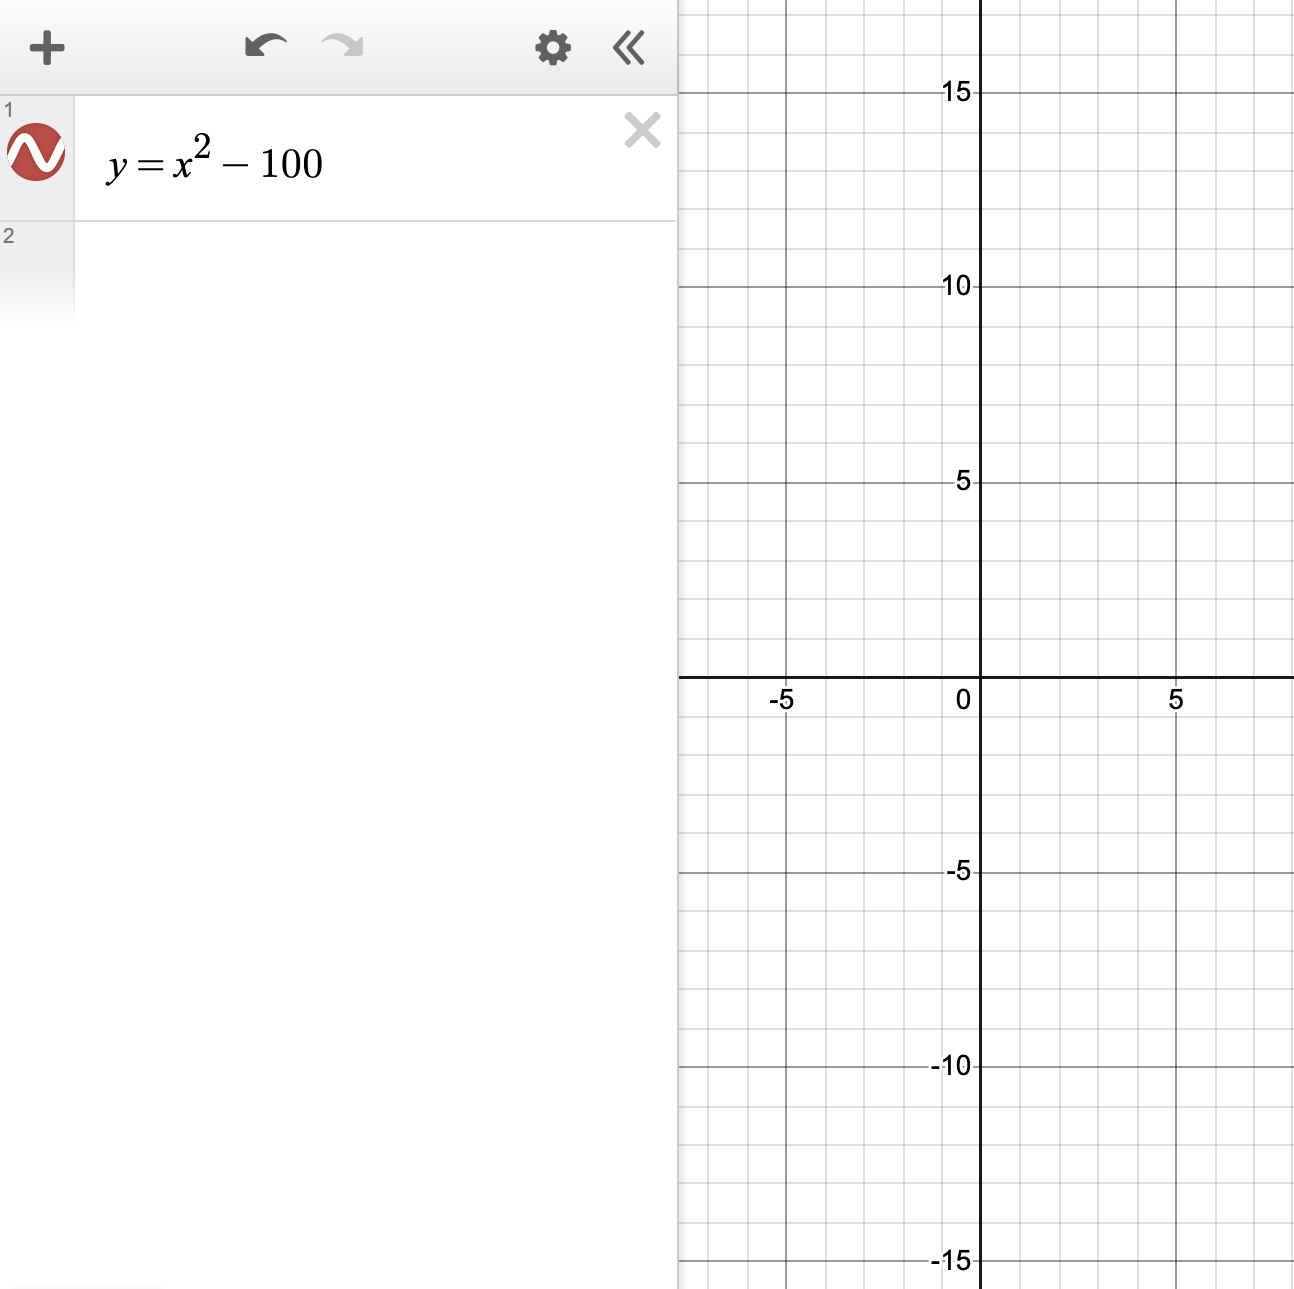
The graph appears to have no x-intercepts, but the roots are actually outside the visible graph window.
Test-Day Strategy
Before solving any question, ask:
- Can I solve this faster by hand?
- Would a graph immediately reveal the answer?
- Can I use a table?
- Can I test answer choices?
- Is there an intersection involved?
Use Desmos when it saves time.
Use algebra when it is faster.
| Goal | Input |
|---|---|
| Square root | sqrt(25) |
| Exponent | 2^5 |
| Absolute value | abs(-7) |
| Greatest common divisor | gcd(24,36) |
| Least common multiple | lcm(12,18) |
| Imaginary unit | i |
| Function evaluation | f(4) |
| Regression | y_1 ~ mx_1 + b |
| Piecewise function | y={expression:condition} |
Quick Reference
| Situation | Recommended Strategy |
|---|---|
| Linear equation | Graph both sides |
| System of equations | Find intersection |
| Quadratic equation | Find roots |
| Function value | Use table or direct evaluation |
| Word problem with two models | Graph both models |
| Maximum/minimum | Find vertex |
| Inequalities | Use shaded regions |
| Transformations | Graph both functions |
| Simple arithmetic | Calculator |
Technology is a tool, not a substitute for understanding.
Strong students know both the mathematics and when technology can make that mathematics faster.
Practice Problems
- Use Desmos to solve \(2x+5=17\).
- Use Desmos to find the intersection of \(y=3x-2\) and \(y=-x+6\).
- Use Desmos to find the zeros of \(y=x^2-5x+6\).
- Use a table to evaluate \(f(x)=2x^2-3x+1\) at \(x=4\).
- Decide whether Desmos or hand-solving is faster for \(7+18\).
1. Graph \(y=2x+5\) and \(y=17\). The intersection has \(x=6\).
2. Enter both equations and select the intersection point. The solution is \((2,4)\).
3. Graph the parabola and select the x-intercepts. The zeros are \(x=2\) and \(x=3\).
4. Enter \(f(x)=2x^2-3x+1\), then evaluate \(f(4)\) or use a table:
\[ f(4)=2(4)^2-3(4)+1=21 \]
5. Hand-solving is faster. Desmos is strongest when graphing, comparing, evaluating functions, or finding intersections.
Summary
- Desmos is most useful for graphs, intersections, roots, tables, and function evaluation.
- The calculator is usually faster for simple arithmetic.
- Graph windows can hide important features, so adjust the view when needed.
- Use technology strategically: only when it saves time or reduces errors.
- Graph both sides of an equation to solve by intersection.
- Use tables for quick function values.
- Tap roots, intercepts, and intersections carefully.
- Check whether the test asks for an exact answer before relying on decimals.