Graphing Linear Inequalities
By the end of this lesson, you’ll be able to:
- Graph linear inequalities in the coordinate plane.
- Determine whether a boundary line should be solid or dashed.
- Shade the correct solution region.
- Use test points to verify solutions.
- Interpret points that satisfy or do not satisfy an inequality.
Key Ideas
A linear inequality represents a region of the coordinate plane rather than a single line.
Examples:
\[ y > 2x + 1 \]
\[ y \le -x + 4 \]
To graph a linear inequality:
- Graph the corresponding boundary line.
- Decide whether the boundary line is solid or dashed.
- Shade the side containing all solutions.
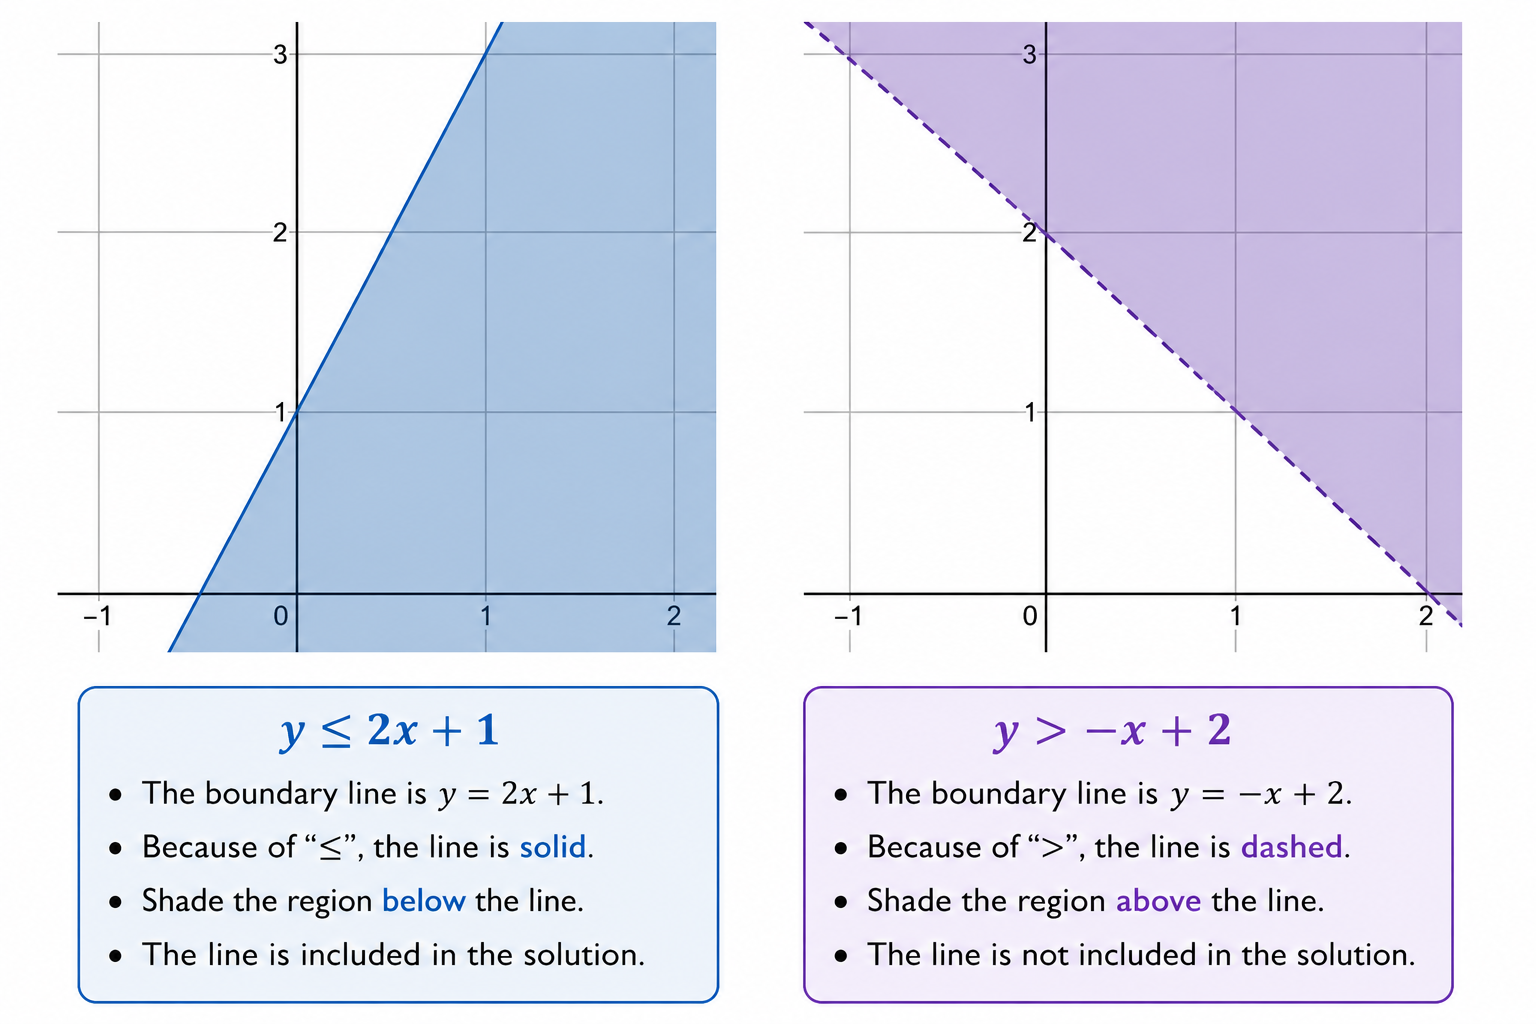
Solid vs. Dashed Lines
The boundary line is included when the inequality contains equality.
| Inequality Symbol | Boundary Line |
|---|---|
| \(<\) | Dashed |
| \(>\) | Dashed |
| \(\le\) | Solid |
| \(\ge\) | Solid |
For inequalities already written as
\[ y \; ? \; mx+b, \]
you can graph them almost instantly:
- \(>\) or \(\ge\) → shade above
- \(<\) or \(\le\) → shade below
- \(\ge\) or \(\le\) → solid line
- \(>\) or \(<\) → dashed line
Memorizing these four rules solves most graphing-inequality questions.
Examples:
\[ y > x + 2 \]
uses a dashed line.
\[ y \le x + 2 \]
uses a solid line.
Above vs. Below
For inequalities written as
\[ y \; ? \; mx+b \]
use:
- \(y > mx+b\) → shade above
- \(y \ge mx+b\) → shade above
- \(y < mx+b\) → shade below
- \(y \le mx+b\) → shade below
Using Test Points
When the correct side is unclear, test a point that is not on the line.
The point \((0,0)\) is often the easiest choice.
Example:
\[ y < x + 2 \]
Test \((0,0)\):
\[ 0 < 0 + 2 \]
\[ 0 < 2 \]
This is true, so shade the side containing \((0,0)\).
Common Problem Types
1. Determine the Boundary Type
Example:
\[ y \ge 3x - 4 \]
Because the symbol is \(\ge\):
- Graph a solid line.
- Shade above the line.
2. Determine the Shading Direction
Example:
\[ y < -2x + 5 \]
Since the symbol is \(<\):
- Graph a dashed line.
- Shade below the line.
3. Use a Test Point
Example:
\[ 2x + y > 4 \]
Graph the boundary line:
\[ 2x + y = 4 \]
Test \((0,0)\):
\[ 2(0)+0>4 \]
\[ 0>4 \]
This is false, so shade the side opposite \((0,0)\).
4. Determine Whether a Point Is a Solution
Example:
Does \((2,5)\) satisfy
\[ y \ge x + 1? \]
Substitute:
\[ 5 \ge 2 + 1 \]
\[ 5 \ge 3 \]
This is true, so \((2,5)\) is a solution.
Strategies
- Graph the boundary line first.
- Decide solid or dashed before shading.
- For inequalities already in slope-intercept form, use the above/below rules.
- Use a test point whenever the shading direction is uncertain.
- Check answer choices by substituting coordinates directly into the inequality.
- Remember that the shaded region represents all possible solutions, not just one point.
Worked Examples
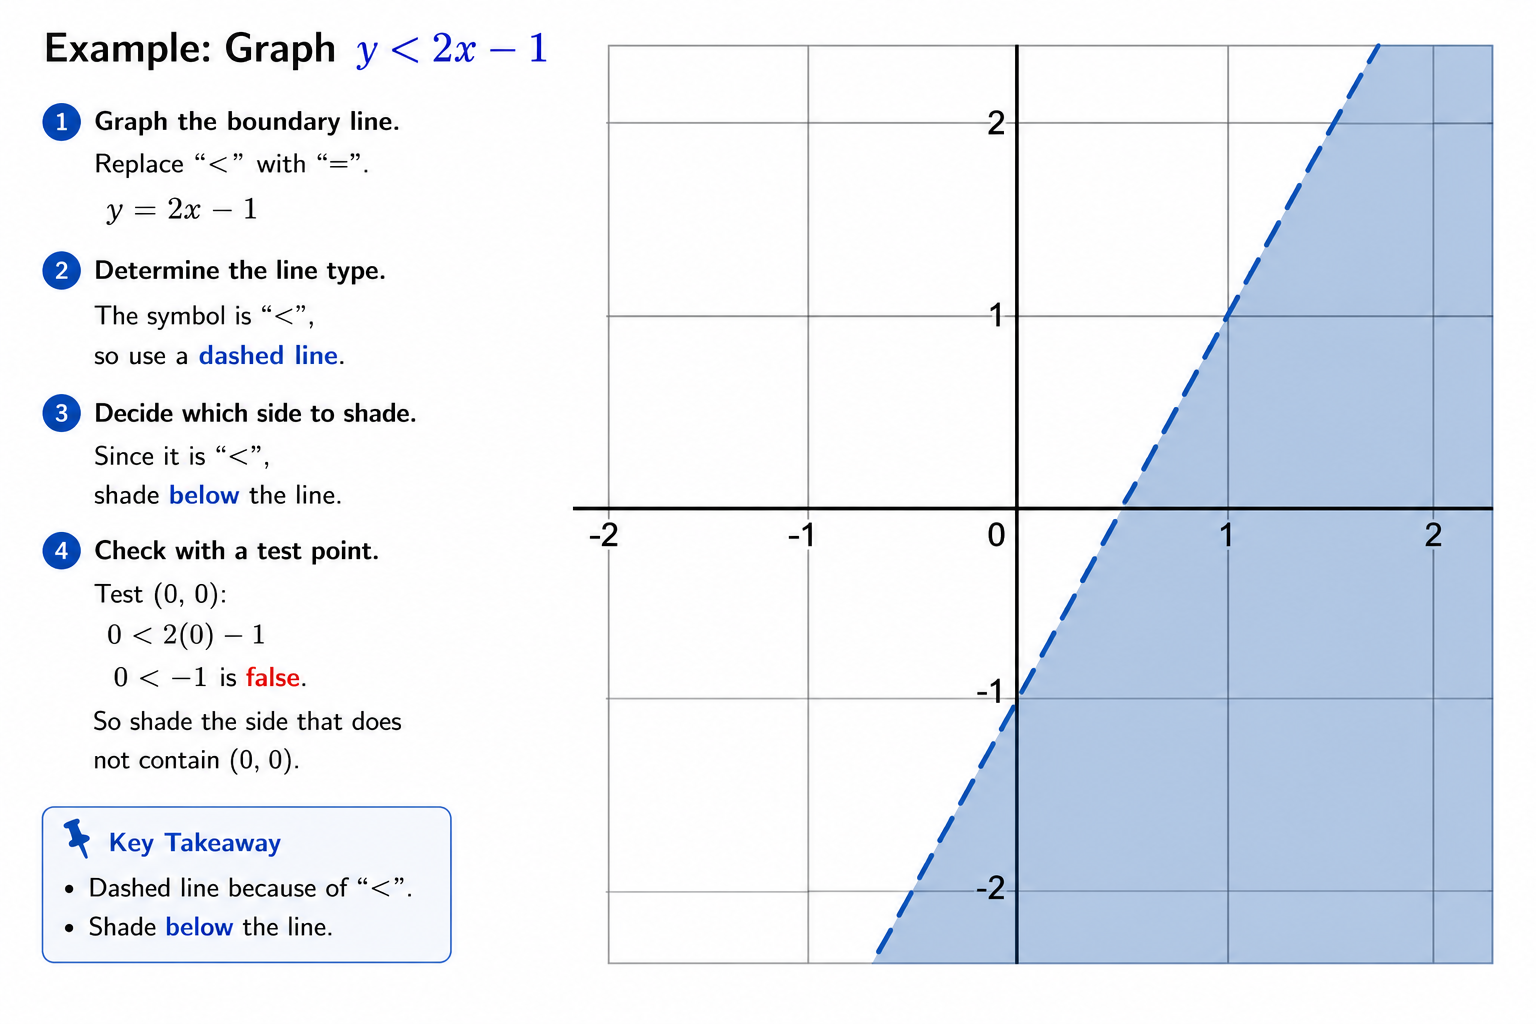
Example 1
Graph:
\[ y < 2x - 1 \]
Step 1: Graph the boundary line.
\[ y = 2x - 1 \]
Step 2: Use a dashed boundary because of \(<\).
Step 3: Shade below the line.
Example 2
Graph:
\[ y \le -x + 3 \]
Step 1: Graph the boundary line.
\[ y = -x + 3 \]
Step 2: Use a solid boundary because of \(\le\).
Step 3: Shade below the line.
Example 3
Determine whether \((1,4)\) satisfies
\[ y > 2x \]
Substitute:
\[ 4 > 2(1) \]
\[ 4 > 2 \]
This is true, so the point is a solution.
Example 4
Graph:
\[ 3x + y < 6 \]
First rewrite in slope-intercept form:
\[ y < -3x + 6 \]
The boundary line is
\[ y = -3x + 6 \]
Because the inequality is \(<\), use a dashed line.
Since \(y < -3x + 6\), shade below the line.
- Using a solid line for \(<\) or \(>\).
- Using a dashed line for \(\le\) or \(\ge\).
- Shading above when the inequality requires below.
- Forgetting to test a point when unsure.
- Confusing the boundary line with the entire solution region.
Practice Problems
- Graph \(y > x + 3\).
- Graph \(y \le -2x + 4\).
- Determine whether \((2,1)\) satisfies \(y < x + 5\).
- Determine whether \((3,7)\) satisfies \(y \ge 2x + 2\).
- Graph \(3x + y < 6\).
1.
The boundary line is
\[ y = x + 3 \]
Use a dashed line because of \(>\).
Shade above the line.
2.
The boundary line is
\[ y = -2x + 4 \]
Use a solid line because of \(\le\).
Shade below the line.
3.
Substitute \((2,1)\) into \(y < x + 5\):
\[ 1 < 2+5 \]
\[ 1<7 \]
This is true, so \((2,1)\) is a solution.
4.
Substitute \((3,7)\) into \(y \ge 2x + 2\):
\[ 7 \ge 2(3)+2 \]
\[ 7 \ge 8 \]
This is false, so \((3,7)\) is not a solution.
5.
Start with:
\[ 3x + y < 6 \]
Subtract \(3x\):
\[ y < -3x + 6 \]
The boundary line is
\[ y = -3x + 6 \]
Use a dashed line because of \(<\).
Shade below the line.
Summary
- Linear inequalities represent regions of the coordinate plane.
- Graph the boundary line first.
- Use dashed lines for \(<\) and \(>\).
- Use solid lines for \(\le\) and \(\ge\).
- Shade above for greater-than inequalities and below for less-than inequalities.
- Test points can verify the correct shading region.
- Dashed means the boundary is not included.
- Solid means the boundary is included.
- Greater than → above.
- Less than → below.
- When in doubt, test \((0,0)\).