Graphing Lines in Standard Form
By the end of this lesson, you’ll be able to:
- Recognize Standard Form \(Ax + By = C\).
- Graph lines by finding the x-intercept and y-intercept.
- Convert equations between standard form and slope-intercept form.
Key Ideas
Standard Form looks like:
\[ Ax + By = C \]
This form is especially convenient for graphing because you can find intercepts quickly.
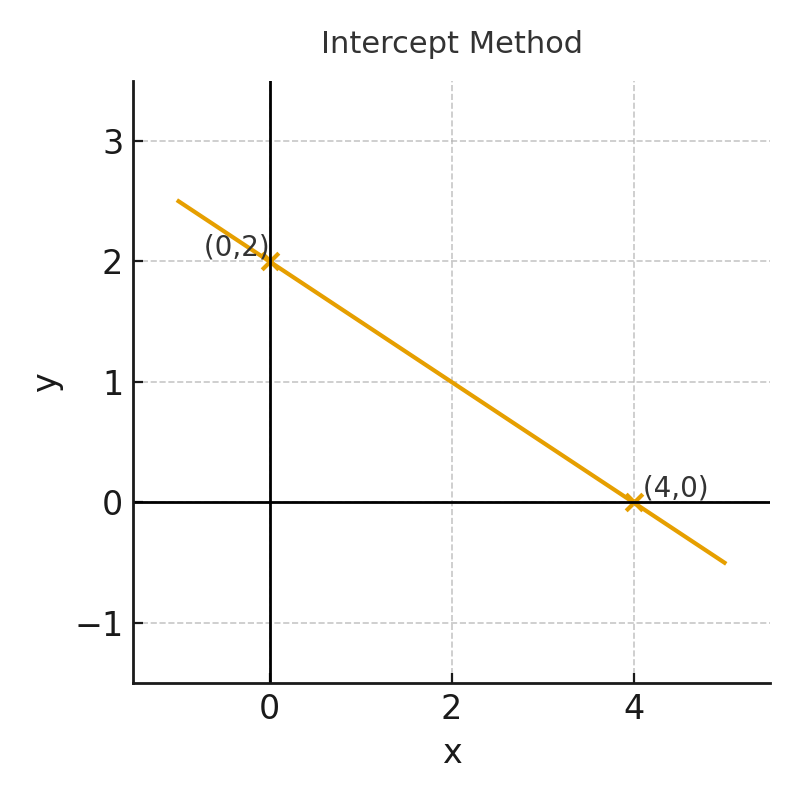
To graph:
- Set \(x = 0\) to find the y-intercept.
- Set \(y = 0\) to find the x-intercept.
- Plot both points and draw the line.
Shortcut: Finding Slope and y-Intercept Directly
Sometimes the test asks about the slope or y-intercept of a line written in standard form.
Starting with
\[ Ax + By = C, \]
solve for \(y\):
\[ By = -Ax + C \]
\[ y = -\frac{A}{B}x + \frac{C}{B} \]
Therefore:
Slope \[ m = -\frac{A}{B} \]
y-intercept \[ b = \frac{C}{B} \]
Example:
\[ 2x + 3y = 12 \]
The slope is
\[ m = -\frac{2}{3} \]
and the y-intercept is
\[ b = \frac{12}{3}=4. \]
This shortcut lets you identify important graph features without fully rewriting the equation in slope-intercept form.
Special cases to remember:
- If \(B = 0\), the equation becomes \(Ax = C\) → vertical line.
- If \(A = 0\), the equation becomes \(By = C\) → horizontal line.
Common Problem Types
1. Graph from Intercepts
Example: Graph \(2x + 3y = 12\).
- x-intercept:
\(2x = 12 \Rightarrow x = 6\)
- y-intercept:
\(3y = 12 \Rightarrow y = 4\)
Plot \((6, 0)\) and \((0, 4)\) and connect.
2. Convert to Slope-Intercept Form
Solve for \(y\):
\[ 3y = -2x + 12 \] \[ y = -\frac{2}{3}x + 4 \]
3. Identify Special Cases
- \(5x = 20\) → vertical line (\(x = 4\))
- \(-3y = 9\) → horizontal line (\(y = -3\))
Strategies
- Use intercepts when the equation is already in standard form — it’s faster than rearranging.
- When solving for \(y\), move the \(x\)-term first; then divide everything by \(B\).
- Re-check signs after moving terms; sign errors are common here.
- If the line looks vertical or horizontal, confirm by checking whether \(A\) or \(B\) is zero.
- Use two intercept points for a clean, accurate graph.
Worked Examples
Example 1
Graph \(4x - 2y = 8\).
- x-intercept: \(4x = 8 \Rightarrow x = 2\)
- y-intercept: \(-2y = 8 \Rightarrow y = -4\)
Plot \((2, 0)\) and \((0, -4)\).
Example 2
Rewrite in slope-intercept form:
\[ 5x + y = 10 \]
Subtract \(5x\):
\[ y = -5x + 10 \]
- Forgetting to divide the constant when solving for intercepts.
- Changing the sign incorrectly when isolating \(y\).
- Mixing up vertical and horizontal lines.
- Dropping a negative sign when moving terms.
Practice Problems
- Graph \(3x + 2y = 12\).
- Graph \(x - 4y = 8\).
- Convert to slope-intercept: \(6x + 2y = 10\).
- Identify special case: \(5x = 20\).
- Convert: \(2y - 8 = 4x\).
1. Graph \(3x + 2y = 12\).
Find the intercepts.
Set \(y=0\):
\[ 3x=12 \]
\[ x=4 \]
So the x-intercept is \((4,0)\).
Set \(x=0\):
\[ 2y=12 \]
\[ y=6 \]
So the y-intercept is \((0,6)\).
Plot \((4,0)\) and \((0,6)\), then draw a straight line through the two points.
Alternative Method
Convert to slope-intercept form:
\[ 2y=-3x+12 \]
\[ y=-\frac32x+6 \]
Start at the y-intercept \((0,6)\) and use the slope \(-\frac32\) (down 3, right 2).
2. Graph \(x - 4y = 8\).
Find the intercepts.
Set \(y=0\):
\[ x=8 \]
So the x-intercept is \((8,0)\).
Set \(x=0\):
\[ -4y=8 \]
\[ y=-2 \]
So the y-intercept is \((0,-2)\).
Plot \((8,0)\) and \((0,-2)\), then draw a straight line through the two points.
3. Convert to slope-intercept form: \(6x + 2y = 10\).
\[ 2y=-6x+10 \]
\[ y=-3x+5 \]
4. Identify special case: \(5x = 20\).
\[ x=4 \]
This is a vertical line through \(x=4\).
5. Convert: \(2y - 8 = 4x\).
\[ 2y=4x+8 \]
\[ y=2x+4 \]
Summary
- Standard form \(Ax + By = C\) is ideal for finding intercepts quickly.
- Use the intercepts to sketch the line efficiently.
- Convert to slope-intercept form when needed by isolating \(y\).
- Special cases occur when \(A = 0\) (horizontal) or \(B = 0\) (vertical).
- For quick graphing: set \(x=0\), set \(y=0\), plot both points.
- Always rewrite slope as a fraction to visualize rise/run.
- Keep track of signs when moving terms across the equals sign.
- If only one variable remains (like \(5x = 20\)), the line is vertical or horizontal.