Graphical Representation of Functions
By the end of this lesson, you’ll be able to:
- Interpret a function’s behavior from its graph.
- Identify key features such as intercepts and intervals of increase/decrease.
- Connect graphs to tables, formulas, and function notation.
Key Ideas
A graph represents all the input–output pairs of a function. Every point on the graph has the form \((x, f(x))\).
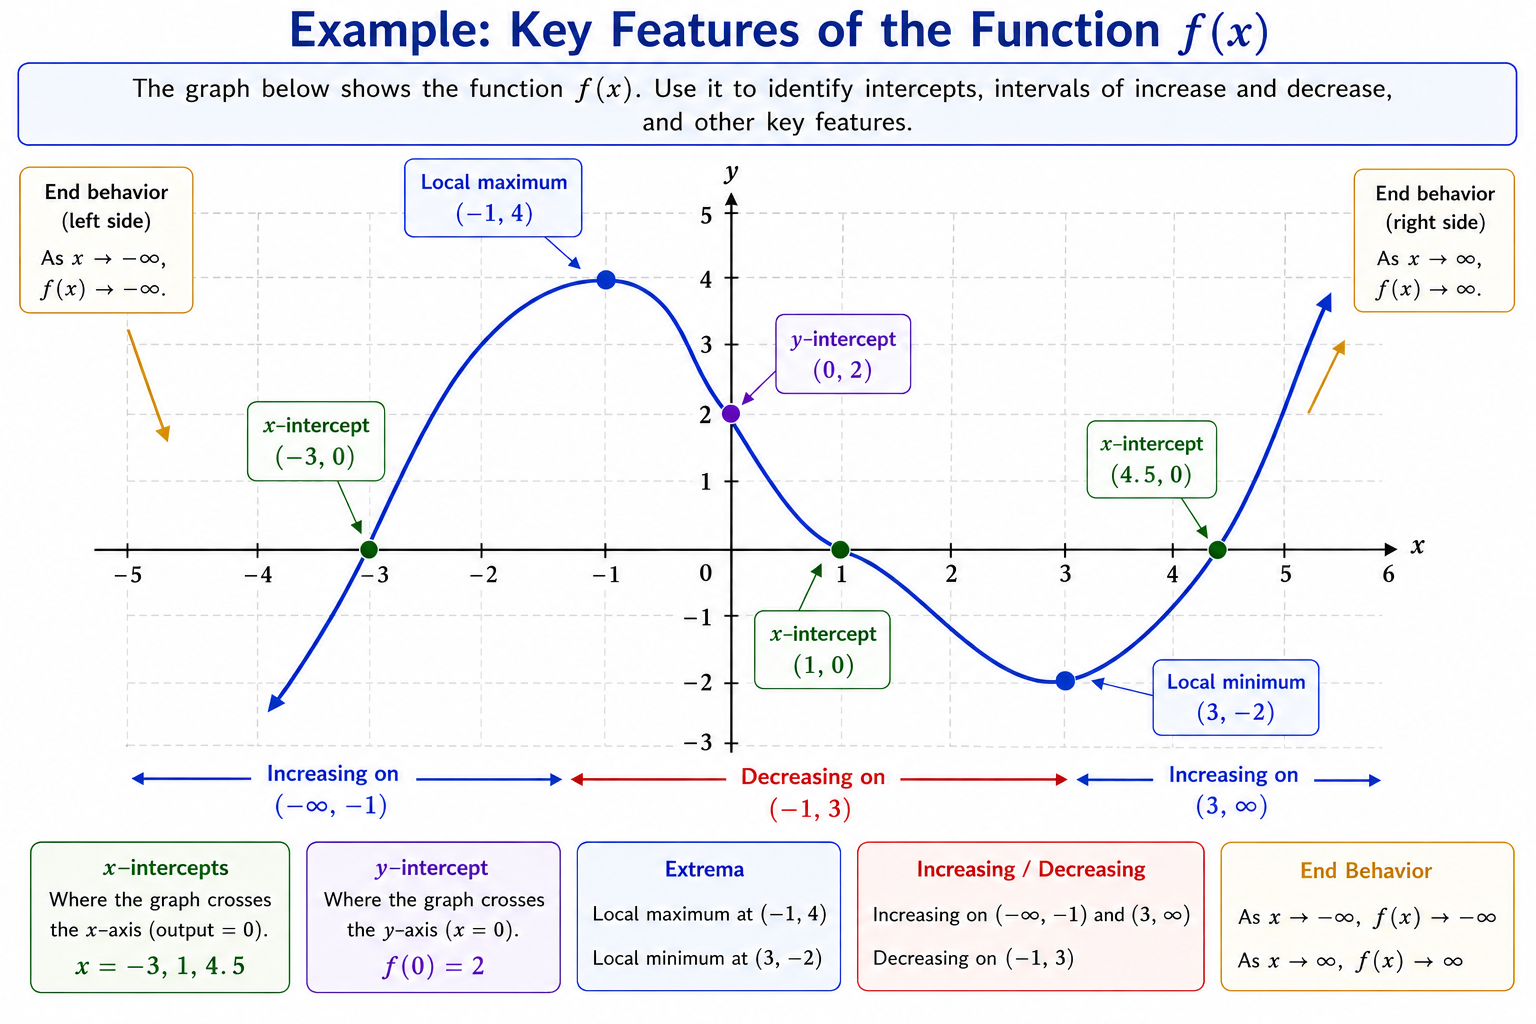
Important features to look for:
- \(x\)-intercepts (where the graph crosses the \(x\)-axis)
- \(y\)-intercept (where it crosses the \(y\)-axis)
- Increasing/decreasing intervals
- Maximum/minimum points
- End behavior (how the graph behaves as \(x\) becomes large or small)
Common Problem Types
1. Intercepts
Read where the graph crosses an axis.
2. Increasing/Decreasing Behavior
Identify where the function rises or falls as \(x\) increases.
3. Reading Function Values
Locate a point with the given \(x\)-value.
4. Connecting Graphs to Rules/Tables
Interpret graph shape relative to formula or table data.
Strategies
- To find the \(y\)-intercept, look at where the graph hits the vertical axis (\(x = 0\)).
- To find \(x\)-intercepts, look for where the graph crosses the \(x\)-axis (output = 0).
- A function is increasing when the graph rises as you move right; decreasing when it falls.
- Use endpoints, turning points, and slope direction to determine behavior.
- Connect visual features to notation: if the graph hits \((3, -2)\), then \(f(3) = -2\).
Worked Examples
Example 1 — Finding a \(y\)-Intercept
If the graph passes through \((0, 4)\), then: \[ f(0) = 4 \]
Example 2 — Increasing Interval
If the graph rises as \(x\) moves from \(1\) to \(4\), the function is increasing on \((1, 4)\).
Example 3 — Reading an \(x\)-Intercept
If the graph crosses the \(x\)-axis at \(x = -3\), then: \[ f(-3) = 0 \]
- Mixing up \(x\)-intercepts and \(y\)-intercepts.
- Reversing intervals when describing increasing/decreasing behavior.
- Assuming the graph is linear between plotted points.
Practice Problems
- A graph shows \(f(0) = -2\). What is the \(y\)-intercept?
- A graph crosses the \(x\)-axis at \(x = 5\). What does this mean?
- If a graph decreases on \((0, 4)\), describe what happens to \(f(x)\).
- A point \((3, 7)\) lies on the graph. What is \(f(3)\)?
- If the graph increases on \((-\infty, -1)\), describe the behavior.
1.
\(y\)-intercept is \((0, -2)\).
2.
The function satisfies \(f(5) = 0\).
3.
As \(x\) increases from 0 to 4, \(f(x)\) decreases.
4.
From the point \((3, 7)\) → \(f(3) = 7\).
5.
As \(x\) moves right toward \(-1\), the function rises.
Summary
- A graph displays all \((x, f(x))\) pairs of a function.
- Key features include intercepts, increasing/decreasing intervals, maxima/minima, and end behavior.
- Use the graph to read outputs directly: find \(x\), then locate the corresponding \(y\).
- Increasing means “rising to the right”; decreasing means “falling to the right.”
- Intercepts reveal where the function touches or crosses the axes.
- Always check the axes first—intercepts give quick insight.
- Use left-to-right movement to identify increasing/decreasing behavior.
- Read values carefully: graphs show approximate values unless labeled.
- Turning points mark changes between rising and falling intervals.