Mean, Median, Mode, and Range
By the end of this lesson, you’ll be able to:
- Compute the mean, median, mode, and range of a dataset.
- Interpret what each statistic tells you about the data.
- Choose an appropriate measure of center for a given context.
- Explain how unusually large or small values can affect the mean, median, and range.
- Compare the centers and spreads of simple datasets.
Key Ideas
A dataset can be summarized using measures of center and spread.
Measures of center describe a typical or central value:
- Mean
- Median
- Mode
A measure of spread describes how far apart the values are:
- Range
Mean
The mean, or arithmetic average, is found by adding all values and dividing by the number of values.
\[ \boxed{ \text{mean} = \frac{\text{sum of the values}}{\text{number of values}} } \]
Using notation:
\[ \bar{x} = \frac{x_1+x_2+\cdots+x_n}{n} \]
or equivalently:
\[ \bar{x} = \frac{1}{n}\sum_{i=1}^{n}x_i \]
where:
- \(\bar{x}\) = mean
- \(n\) = number of values
- \(x_i\) = each individual value
For example, for:
\[ 4,\ 7,\ 5,\ 6 \]
the mean is:
\[ \bar{x} = \frac{4+7+5+6}{4} \]
\[ = \frac{22}{4} \]
\[ \boxed{5.5} \]
Median
The median is the middle value after the data are arranged from least to greatest.
Always sort the data first.
If the number of values is odd, use the single middle value.
For example:
\[ 2,\ 5,\ 9 \]
has median:
\[ \boxed{5} \]
If the number of values is even, average the two middle values.
For example:
\[ 1,\ 4,\ 6,\ 7 \]
The two middle values are 4 and 6:
\[ \text{median} = \frac{4+6}{2} \]
\[ \boxed{5} \]
Mode
The mode is the value that occurs most frequently.
A dataset may have:
- one mode
- more than one mode
- no mode
For example:
\[ 2,\ 3,\ 3,\ 4,\ 5 \]
has mode:
\[ \boxed{3} \]
The dataset:
\[ 3,\ 3,\ 8,\ 8,\ 10 \]
has two modes:
\[ \boxed{3\text{ and }8} \]
The dataset:
\[ 5,\ 7,\ 9 \]
has no mode because no value occurs more frequently than the others.
Unlike mean and median, the mode can also describe nonnumeric categories.
For example, if the most commonly chosen shirt color is blue, then blue is the mode.
Range
The range measures the distance between the largest and smallest values.
\[ \boxed{ \text{range} = \text{maximum} - \text{minimum} } \]
For example:
\[ 9,\ 10,\ 11,\ 14 \]
has:
\[ \text{range} = 14-9 \]
\[ \boxed{5} \]
Range is a measure of spread, not center.
Choosing a Measure of Center
The mean and median can describe different aspects of the same dataset.
Mean
The mean:
- uses every value in the dataset
- changes when any value changes
- can be strongly affected by unusually high or low values
The mean is often useful when the data do not contain extreme values that distort the center.
Median
The median:
- depends mainly on the position of the values
- is less affected by extreme values
- can better represent a typical value when the data are strongly skewed
Mode
The mode is useful when you want to know:
- the most common numerical value
- the most common category
Effect of an Outlier
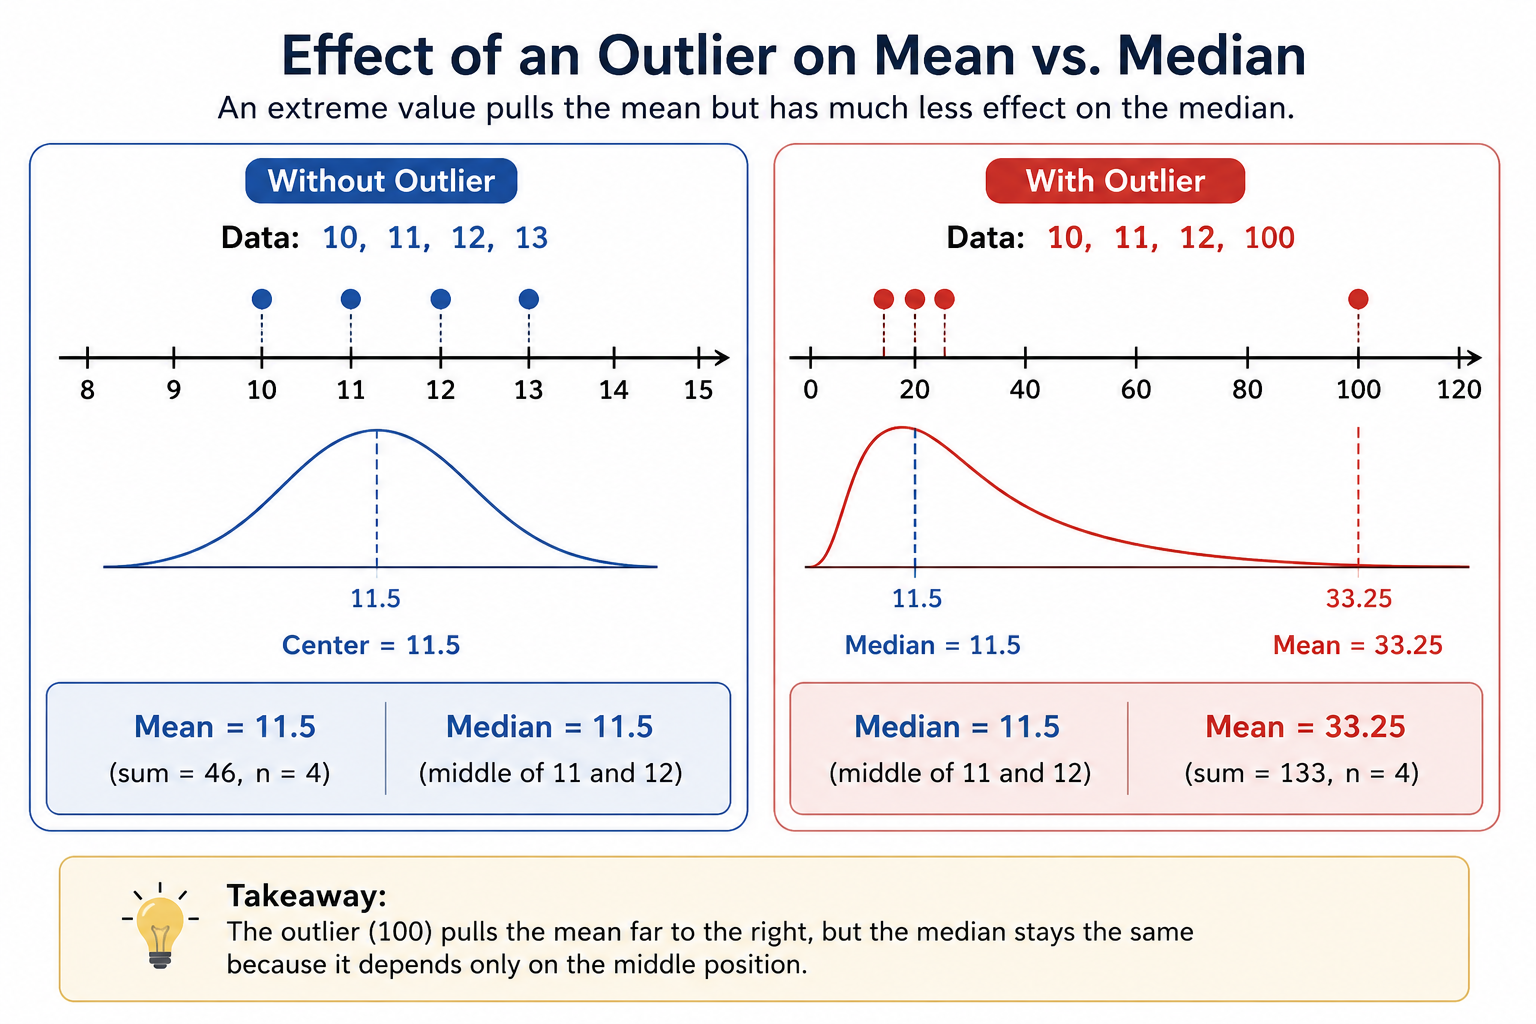
An outlier is a value that is unusually far from most of the other values.
Consider:
\[ 10,\ 11,\ 12,\ 13 \]
The mean is:
\[ \frac{10+11+12+13}{4} = 11.5 \]
and the median is:
\[ \frac{11+12}{2} = 11.5 \]
Now replace 13 with 100:
\[ 10,\ 11,\ 12,\ 100 \]
The mean becomes:
\[ \frac{10+11+12+100}{4} = 33.25 \]
but the median is:
\[ \frac{11+12}{2} = 11.5 \]
The extreme value dramatically changes the mean but does not change the median.
There is no rule that the mean or median is always the “better” statistic.
Choose the measure that best represents the data and the question being asked.
When extreme values or strong skew are present, the median is often more representative of a typical observation.
Common Problem Types
1. Computing All Four Statistics
You may be asked to find the mean, median, mode, and range from the same dataset.
Sort the data first, then compute each statistic carefully.
Be clear about which statistic the question asks for.
2. Finding the Median
Always sort the data first.
If there is an odd number of values, the median is the middle value.
If there is an even number of values, average the two middle values.
3. Identifying the Mode
Look for the value or values that occur most often.
There may be one mode, more than one mode, or no mode.
4. Comparing Mean and Median With an Extreme Value
An unusually large or small value pulls the mean more than the median.
The median often better represents a typical value when the dataset has an extreme value.
5. Choosing a Measure of Center in Context
Use the mean when the data are fairly balanced.
Use the median when outliers or skewed values would make the mean misleading.
6. Comparing Two Datasets
Compare the requested statistics directly: means to means, medians to medians, ranges to ranges.
A higher center does not mean every value in one dataset is greater than every value in the other.
7. Understanding Changes to a Dataset
Different statistics respond differently when a value is added or removed.
For example, adding one extreme value may cause:
- mean increases substantially
- median changes only slightly
- mode may stay the same
- range increases substantially
A single new value does not necessarily affect every statistic in the same way.
8. Interpreting Range
Range depends only on:
- the minimum value
- the maximum value
Because range depends entirely on the extremes, it is very sensitive to unusually large or small values.
Strategies
- Sort the data first when finding the median or mode.
- For the mean, check both the sum and the number of values.
- For an even number of values, average the two middle values to find the median.
- Do not assume every dataset has a mode.
- Check for unusually high or low values before deciding whether mean or median is more representative.
- Remember that range measures spread, not center.
- When comparing datasets, pay attention to which statistic is being compared.
- Use units and context when interpreting your answer.
- Avoid rounding until the final step unless instructed otherwise.
Worked Examples
Example 1 — Find Mean, Median, Mode, and Range
Consider:
\[ 12,\ 15,\ 12,\ 18,\ 20 \]
First sort the data:
\[ 12,\ 12,\ 15,\ 18,\ 20 \]
Mean
Add the values:
\[ 12+12+15+18+20=77 \]
There are 5 values:
\[ \bar{x} = \frac{77}{5} \]
\[ \bar{x}=15.4 \]
Median
The middle value is:
\[ 15 \]
Mode
The most frequent value is:
\[ 12 \]
Range
\[ 20-12=8 \]
Therefore:
\[ \boxed{ \text{Mean}=15.4,\quad \text{Median}=15,\quad \text{Mode}=12,\quad \text{Range}=8 } \]
Example 2 — Even Number of Values and an Outlier
Consider:
\[ 5,\ 7,\ 8,\ 40 \]
The data are already sorted.
Mean
\[ \bar{x} = \frac{5+7+8+40}{4} \]
\[ = \frac{60}{4} \]
\[ =15 \]
Median
The middle two values are 7 and 8:
\[ \text{median} = \frac{7+8}{2} \]
\[ =7.5 \]
Mode
No value repeats.
Therefore:
\[ \text{no mode} \]
Range
\[ 40-5=35 \]
So:
\[ \boxed{ \text{Mean}=15,\quad \text{Median}=7.5,\quad \text{No mode},\quad \text{Range}=35 } \]
The value 40 is much larger than the other observations.
It pulls the mean up to 15, while the median remains near the center of the smaller values.
For this dataset, the median gives a better sense of a typical observation.
Example 3 — Effect of Adding a Value
A dataset is:
\[ 6,\ 8,\ 10 \]
Its mean is:
\[ \frac{6+8+10}{3}=8 \]
Now add the value 20:
\[ 6,\ 8,\ 10,\ 20 \]
The new mean is:
\[ \frac{6+8+10+20}{4} = \frac{44}{4} = 11 \]
The mean increases from:
\[ 8\to11 \]
because the new value is greater than the original mean.
If you add a value that is:
- greater than the current mean → the mean increases
- less than the current mean → the mean decreases
- equal to the current mean → the mean stays the same
Example 4 — Choosing Mean or Median
Suppose home prices in a small neighborhood are:
\[ \$220{,}000,\quad \$230{,}000,\quad \$240{,}000,\quad \$250{,}000,\quad \$1{,}500{,}000 \]
Most homes cost between $220,000 and $250,000, but one home is much more expensive.
That extreme value raises the mean considerably.
The median is the middle value:
\[ \boxed{\$240{,}000} \]
In this situation, the median better represents the price of a typical home in the dataset.
- Forgetting to sort before finding the median.
- Dividing the sum by the wrong number of observations when finding the mean.
- Choosing the wrong two middle values when the dataset has an even number of observations.
- Reporting a mode when every value occurs equally often.
- Confusing range with a measure of center.
- Assuming the median must be one of the original values when there are an even number of observations.
- Assuming the mean must be one of the values in the dataset.
- Ignoring the effect of unusually high or low values.
- Saying one group is completely higher than another just because its mean or median is higher.
- Forgetting units when interpreting a statistic.
Practice Problems
- Compute the mean, median, mode, and range for:
\[ 3,\ 7,\ 7,\ 2,\ 9,\ 10 \]
- For:
\[ 18,\ 24,\ 22,\ 30,\ 22,\ 21 \]
compute the mean, median, mode, and range. Which measure of center would reasonably describe the dataset?
- Test scores are:
\[ 86,\ 92,\ 75,\ 92,\ 88,\ 100,\ 58 \]
Compute the mean, median, mode, and range. Explain how the low score affects the mean compared with the median.
- Consider the annual incomes:
\[ \$38{,}000,\quad \$41{,}000,\quad \$43{,}000,\quad \$46{,}000,\quad \$900{,}000 \]
Would the mean or median better represent a typical income in this dataset? Explain.
The mean of five numbers is 12. What is the sum of the five numbers?
A dataset has mean 20. A new value of 30 is added. Will the mean increase, decrease, or stay the same?
1. First sort the data:
\[ 2,\ 3,\ 7,\ 7,\ 9,\ 10 \]
Mean
Add the values:
\[ 2+3+7+7+9+10=38 \]
There are 6 values:
\[ \bar{x} = \frac{38}{6} \]
\[ = \frac{19}{3} \approx6.33 \]
Median
The middle two values are 7 and 7:
\[ \text{median} = \frac{7+7}{2} = 7 \]
Mode
The value 7 occurs most often:
\[ \text{mode}=7 \]
Range
\[ 10-2=8 \]
Therefore:
\[ \boxed{ \text{Mean}\approx6.33,\quad \text{Median}=7,\quad \text{Mode}=7,\quad \text{Range}=8 } \]
2. Sort the data:
\[ 18,\ 21,\ 22,\ 22,\ 24,\ 30 \]
Mean
\[ 18+21+22+22+24+30=137 \]
\[ \bar{x} = \frac{137}{6} \approx22.83 \]
Median
The middle values are 22 and 22:
\[ \text{median} = \frac{22+22}{2} = 22 \]
Mode
\[ \text{mode}=22 \]
Range
\[ 30-18=12 \]
Therefore:
\[ \boxed{ \text{Mean}\approx22.83,\quad \text{Median}=22,\quad \text{Mode}=22,\quad \text{Range}=12 } \]
There is no extremely unusual value, and the mean and median are fairly close.
Either can reasonably describe the center, although the value 30 pulls the mean slightly above the median.
3. Sort the scores:
\[ 58,\ 75,\ 86,\ 88,\ 92,\ 92,\ 100 \]
Mean
Add the scores:
\[ 58+75+86+88+92+92+100=591 \]
There are 7 scores:
\[ \bar{x} = \frac{591}{7} \approx84.43 \]
Median
The fourth value is:
\[ 88 \]
Mode
The most frequent score is:
\[ 92 \]
Range
\[ 100-58=42 \]
Therefore:
\[ \boxed{ \text{Mean}\approx84.43,\quad \text{Median}=88,\quad \text{Mode}=92,\quad \text{Range}=42 } \]
The low score of 58 pulls the mean downward.
The median depends on the middle position, so it is less affected.
For describing a typical score in this dataset, the median may therefore be more representative.
4. The income $900,000 is much larger than the other four incomes.
It will pull the mean upward substantially.
The sorted values are:
\[ 38{,}000,\quad 41{,}000,\quad 43{,}000,\quad 46{,}000,\quad 900{,}000 \]
The median is:
\[ \$43{,}000 \]
which is much closer to most of the observations.
Therefore:
\[ \boxed{\text{median}} \]
better represents a typical income in this dataset.
5. Use:
\[ \text{mean} = \frac{\text{sum}}{\text{number of values}} \]
We know:
\[ 12 = \frac{\text{sum}}{5} \]
Multiply both sides by 5:
\[ \text{sum}=12(5) \]
\[ \boxed{60} \]
6. The current mean is:
\[ 20 \]
The new value is:
\[ 30 \]
Since:
\[ 30>20 \]
the new value is above the current mean.
Therefore, it pulls the mean upward.
\[ \boxed{\text{The mean increases}} \]
Summary
- Mean is the sum of the values divided by the number of values:
\[ \bar{x} = \frac{\text{sum}}{n} \]
- Median is the middle value after sorting the data.
- Mode is the most frequently occurring value or category.
- Range measures spread:
\[ \text{range} = \text{maximum}-\text{minimum} \]
- The mean uses every observation and can be strongly affected by extreme values.
- The median is less affected by unusually high or low observations.
- Range is also highly sensitive to extreme values.
- The best measure of center depends on the shape of the data and the context.
- Mean → add, then divide.
- Median → sort, then find the middle.
- Mode → most frequent.
- Range → max minus min.
- Even number of values → average the two middle values.
- Extreme values affect the mean and range strongly.
- Median is often useful when data are strongly skewed.
- Always interpret statistics in the context of the problem.