Graphing Exponential Functions
By the end of this lesson, you’ll be able to:
- Identify exponential growth and decay from a graph.
- Understand the roles of \(a\) (initial value) and \(b\) (growth/decay factor).
- Recognize the horizontal asymptote of an exponential function.
- Compare exponential vs linear behavior on the same axes.
- Interpret key features of exponential graphs (initial value, growth factor, and direction).
Key Ideas
An exponential function has the form
\[ y = a \, b^x \]
where:
\(a\) = initial value (vertical stretch/shrink or flip)
\(b\) = growth or decay factor
- \(b > 1\) → growth
- \(0 < b < 1\) → decay
- \(b > 1\) → growth
Important graphical features:
- The graph passes through \((0, a)\) because \(b^0 = 1\).
- The horizontal asymptote is \(y = 0\) (unless there is a vertical shift).
- Exponential growth curves rise more and more quickly as \(x\) increases.
- Exponential decay curves decrease and get closer and closer to \(0\) as \(x\) increases.
Basic Exponential Shapes
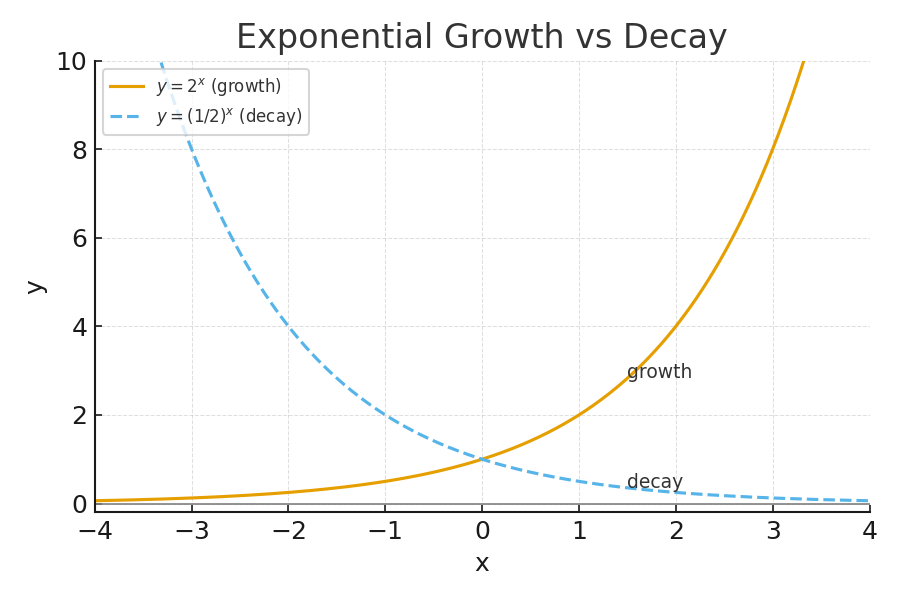
Growth (\(b > 1\))
Example: \(y = 2^x\)
- Passes through \((0, 1)\)
- Increases slowly at first, then very rapidly
- Stays above the \(x\)-axis and approaches \(0\) as \(x \to -\infty\)
Decay (\(0 < b < 1\))
Example: \(y = \left(\frac{1}{2}\right)^x\)
- Passes through \((0, 1)\)
- Decreases as \(x\) increases
- Gets closer to \(0\) but never reaches it
In both cases, the asymptote is \(y = 0\).
Effects of Parameters
The Role of \(a\)
In \(y = a \, b^x\):
- If \(a > 0\), the graph stays above the asymptote.
- If \(a < 0\), the graph is flipped across the \(x\)-axis (below the asymptote).
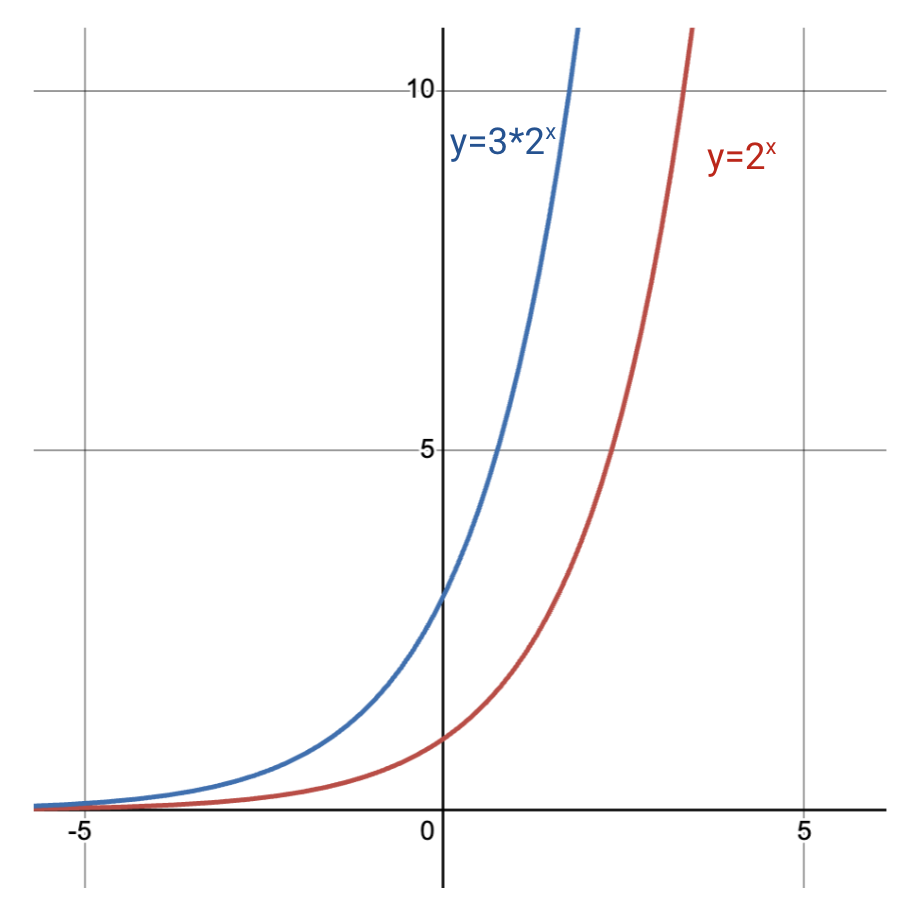
- If \(|a| > 1\), the graph is vertically stretched (steeper away from the asymptote).
- If \(0 < |a| < 1\), the graph is vertically compressed (closer to the asymptote).
Example: \(y = 3 \cdot 2^x\) is a vertical stretch of \(y = 2^x\) by a factor of 3.
The Role of \(b\)
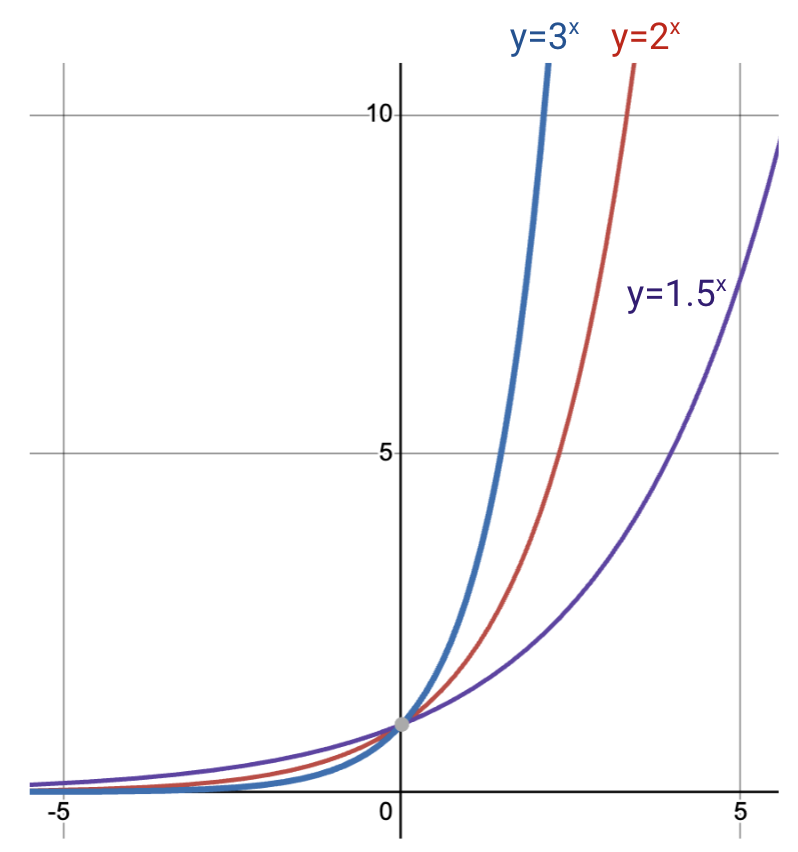
- Larger \(b\) (e.g., \(3^x\) vs \(2^x\)) → faster growth.
- \(0 < b < 1\) → decay (the closer \(b\) is to \(0\), the faster the decay).
Example: compare \(2^x\), \(3^x\), and \(1.5^x\) on the same axes.
Transformations
A more general exponential function can be written as
\[ y = a \, b^{(x - h)} + k \]
where:
- \(h\) = horizontal shift
- \(k\) = vertical shift
Effects:
- \(x - h\) shifts the graph right by \(h\) units (if \(h > 0\)).
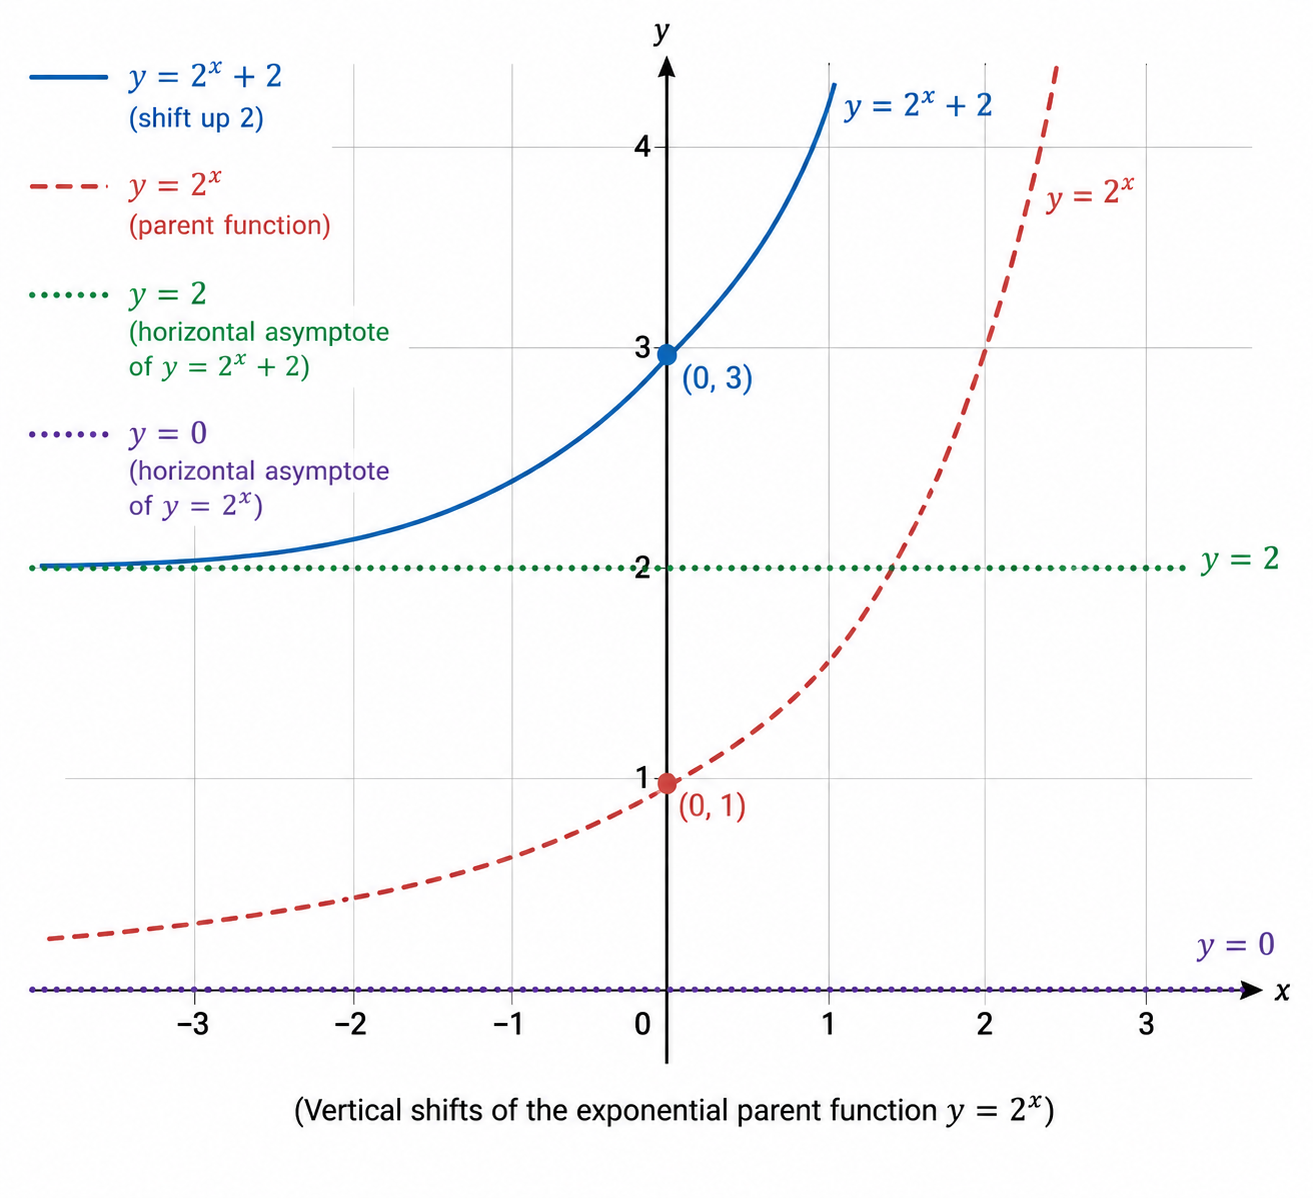
- \(+k\) shifts the graph up by \(k\) units and moves the asymptote to \(y = k\).
Example:
\[ y = 2^x + 2 \]
- Same shape as \(y = 2^x\)
- Shifted up 2 units
- New asymptote: \(y = 3\)
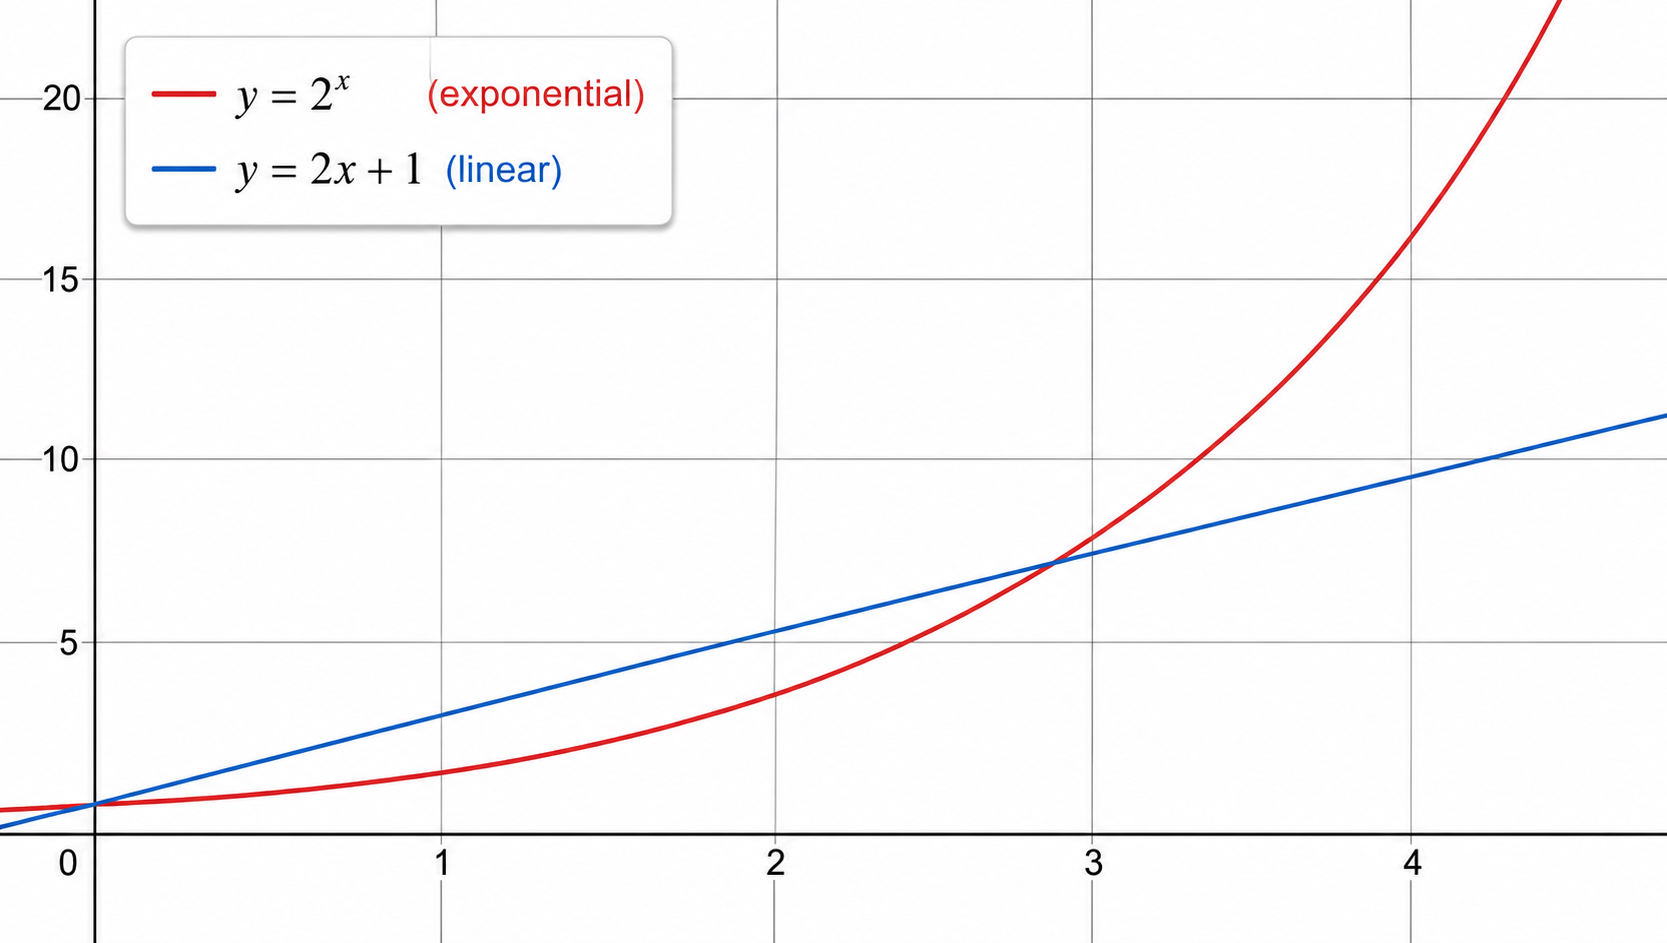
Exponential vs Linear
- Linear functions have a constant difference between \(y\)-values (add the same amount each step).
- Exponential functions have a constant ratio between \(y\)-values (multiply by the same factor each step).
Example:
- Linear: \(y = 2x + 1\) adds \(2\) each time \(x\) increases by 1.
- Exponential: \(y = 2^x\) multiplies by \(2\) each time \(x\) increases by 1.
On a graph, exponentials eventually outgrow linear functions.
Common Problem Types
- Identify growth vs decay from a graph (increasing vs decreasing as \(x\) increases).
- Find the initial value \(a\) from the point where \(x = 0\).
- Identify the asymptote from the long-term behavior of the graph.
- Determine whether \(b > 1\) or \(0 < b < 1\) based on whether the function is growing or decaying.
- Match graphs to equations using \((0, a)\) and the asymptote.
Strategies
- Start by finding the point where \(x = 0\); its \(y\)-coordinate is the initial value \(a\).
- Check whether the graph is increasing (growth) or decreasing (decay) as \(x\) increases.
- Look at the end behavior: what \(y\)-value does the graph get close to? That’s the horizontal asymptote.
- Remember: without a vertical shift, the asymptote is \(y = 0\).
- Use a small table of values if needed: compare ratios between consecutive \(y\)-values.
Worked Examples
Example 1 — Identify Growth vs Decay and Asymptote
Given the graph below, determine whether it represents exponential growth or decay and identify the asymptote.
Solution:
- The curve decreases as \(x\) increases → this is decay.
- The curve gets closer and closer to the \(x\)-axis but never crosses it → the asymptote is \(y = 0\).
Example 2 — Identify the Initial Value
A graph of \(y = a b^x\) passes through the point \((0, 4)\). What is \(a\)?
Solution:
For any exponential \(y = a b^x\):
\[ y(0) = a b^0 = a \cdot 1 = a \]
So if the point \((0, 4)\) is on the graph, then \(a = 4\).
Example 3 — Determine Whether \(b > 1\) or \(0 < b < 1\)
A graph of an exponential passes through \((0, 3)\) and increases rapidly as \(x\) increases. What can you say about \(b\)?
Solution:
- The graph is increasing as \(x\) increases → exponential growth.
- For growth, we must have \(b > 1\).
- The point \((0, 3)\) tells us \(a = 3\).
So the function looks like \(y = 3 b^x\) with \(b > 1\).
- Confusing exponential growth with linear growth (exponential curves accelerate instead of increasing at a constant rate).
- Forgetting that the asymptote is \(y = 0\) unless there is a vertical shift \(+k\).
- Thinking decay graphs “hit” the \(x\)-axis; they get closer but never actually reach \(y = 0\).
- Misreading the initial value by looking at the wrong point instead of \(x = 0\).
Practice Problems
Is the graph of \(y = 0.7^x\) growth or decay?
What is the horizontal asymptote of \(y = 5 \cdot 3^x\)?
The graph of \(y = a b^x\) passes through \((0, 2)\). What is \(a\)?
An exponential graph is decreasing as \(x\) increases. What must be true about \(b\)?
A graph has horizontal asymptote \(y = -3\). What general form must its equation have?
1.
\(y = 0.7^x\) has base \(b = 0.7\). Since \(0 < 0.7 < 1\), this is decay.
2.
In \(y = 5 \cdot 3^x\), there is no vertical shift.
The horizontal asymptote is:
\[ y = 0. \]
3.
For \(y = a b^x\):
\[ y(0) = a \]
Since \((0, 2)\) is on the graph, \(a = 2\).
4.
If the graph is decreasing as \(x\) increases, it represents decay, so:
\[ 0 < b < 1. \]
5.
If the horizontal asymptote is \(y = -3\), the equation must be of the form:
\[ y = a b^x - 3 \]
(or more generally \(y = a b^{x - h} - 3\)).
The “\(-3\)” shifts the entire graph down and moves the asymptote from \(y = 0\) to \(y = -3\).
Summary
- Exponential functions have the form \(y = a b^x\) and pass through \((0, a)\).
- If \(b > 1\), the graph shows exponential growth; if \(0 < b < 1\), it shows decay.
- Without vertical shifts, the horizontal asymptote is \(y = 0\).
- Parameter \(a\) controls the initial value and vertical stretch/flip; \(b\) controls growth vs decay and how steeply the graph changes.
- Exponential graphs eventually outgrow or out-decay linear graphs because they multiply by a constant factor instead of adding a constant amount.
- Use the point where \(x = 0\) to read \(a\).
- Look at the direction of the graph: increasing → \(b > 1\); decreasing → \(0 < b < 1\).
- Check long-term behavior to identify the horizontal asymptote.
- Remember: exponential = constant ratio, linear = constant difference.